
Demand Planning
Forecasting Approach & Performance Evaluation
How PLAIO generates rolling forecasts and evaluates their performance with Error and Bias metrics.
Introduction
This document presents PLAIO’s forecasting methodology and evaluation framework designed to enhance data-driven decision making. The approach employs rolling forecasts that adapt continuously through S&OP cycles, replacing traditional static annual projections with a more responsive planning process.
PLAIO’s evaluation system utilises two complementary metrics, Error and Bias, when combined provide more nuanced performance analysis than conventional accuracy measures.
Forecasting Cadence
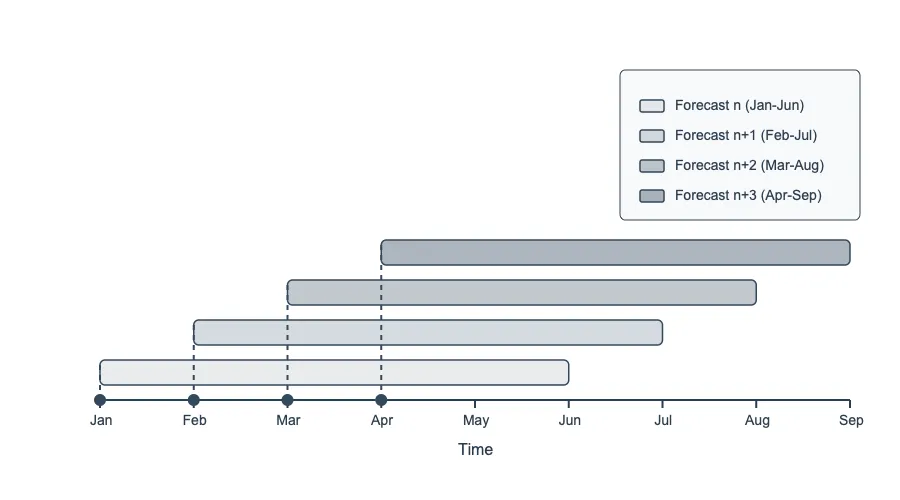
Rather than relying on a single annual forecast, PLAIO utilises a rolling forecast approach. This method involves generating multiple forecasts throughout the year, ensuring that our projections remain adaptable and responsive to changes in each S&OP cycle. This cadence enables regular evaluations of forecast performance via metrics and provides a framework for improving forecast reliability and supporting data-driven decision making. Each forecast (n, n+1, n+2, n+3) covers specific periods with overlapping timeframes, allowing for continuous monitoring and adjustment.
Within each forecast is a value for every period that is being forecasted across the horizon. Metrics are then calculated for each forecast (values within the forecast horizon used) allowing monitoring of how forecasts are performing over time.
Forecast Metrics
Overview
PLAIO uses two key metrics for evaluating forecast performance: Error and Bias. These metrics provide complementary insights into forecast performance, allowing organisations to better understand their forecasting capabilities and identify areas for improvement.
Why these metrics matter
Traditional forecast accuracy metrics often fail to distinguish between different types of forecasting errors. Our Error and Bias metrics address this limitation by separating two critical aspects of forecast performance:
- Error: Quantifies the overall magnitude of forecast inaccuracy.
- Bias: Identifies systematic tendencies to over-forecast or under-forecast.
Together, these metrics provide a comprehensive view of forecast quality that can guide process improvements and help stakeholders understand the reliability of forecasts.
Benefits
- Clear diagnostics: distinguish between random error and systematic bias.
- Actionable insights: different types of forecast issues require different solutions.
- Simple benchmarking: easy to compare across different products, regions, or time periods.
- Intuitive communication: stakeholders can easily understand what the metrics represent.
- Process improvement: identify specific forecasting issues to address in your process.
Error metric
The Error metric measures the absolute magnitude of forecasting errors relative to the total of actual values. The result is expressed as a positive percentage.
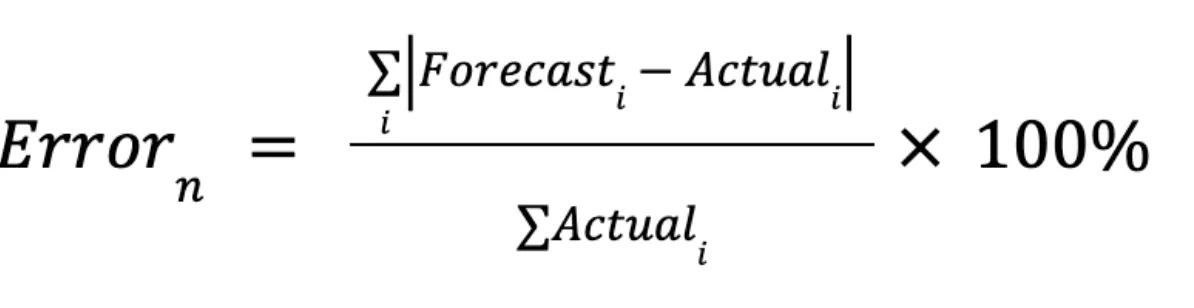
Where n is the nth forecast and i is the ith period where you have a historical forecast value and historical actual.
Bias metric
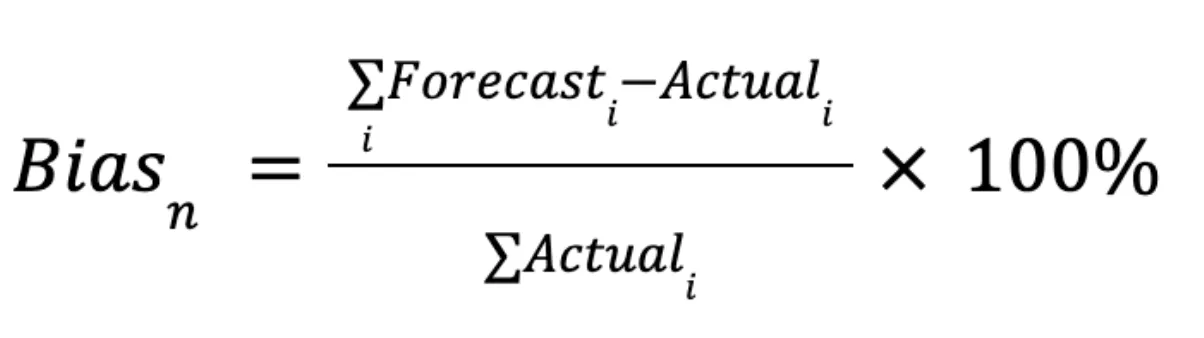
The Bias metric measures the systematic tendency to over-forecast or under-forecast. The result is expressed as a positive or negative percentage.
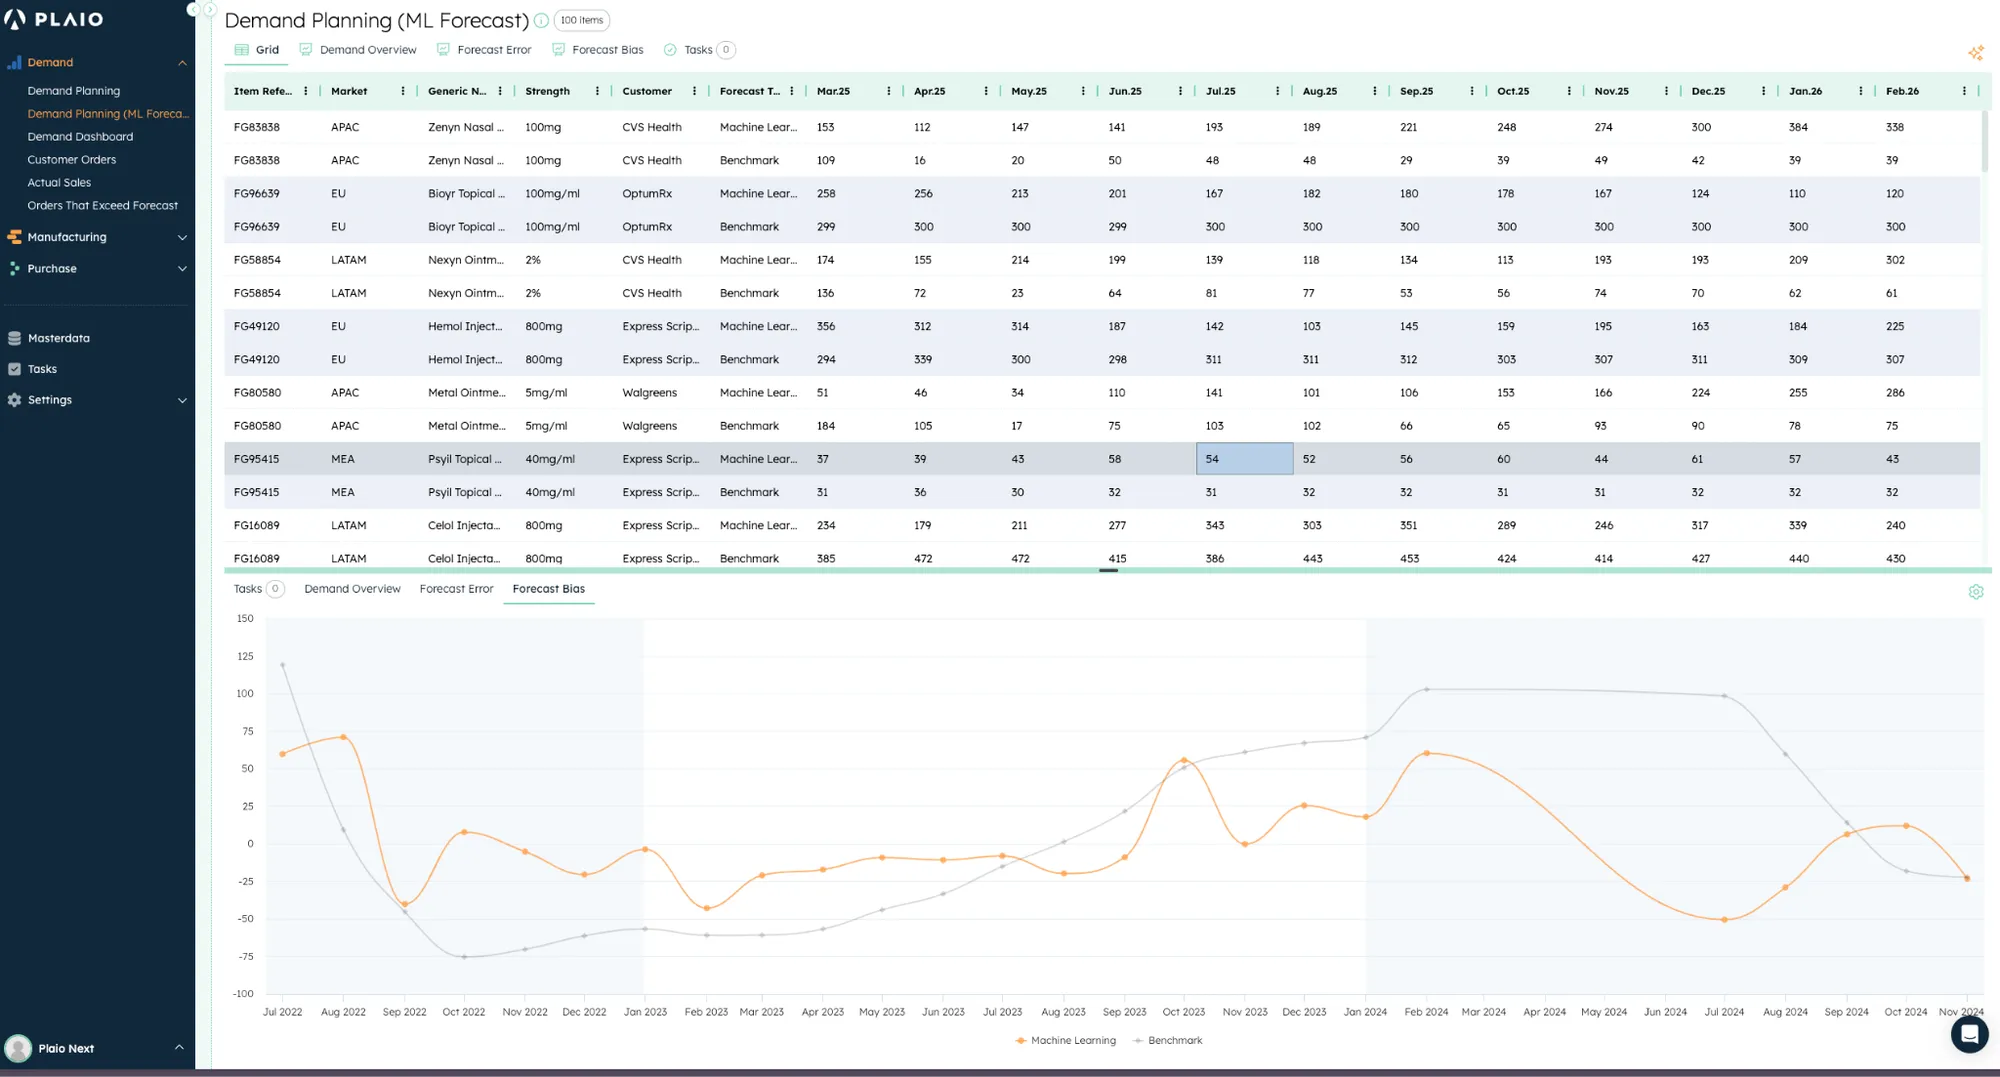
Interpretation guide
Error
- What it tells you: the overall magnitude of forecasting errors relative to the actual values.
- Target value: 0% (perfect forecasts).
- Interpretation: lower values indicate better forecast accuracy. Error is always positive.
Bias
- What it tells you: the directional tendency of forecasts.
- Target value: 0% (no systematic bias).
- Positive bias (e.g. +10%): systematically over-forecasting.
- Negative bias (e.g. -10%): systematically under-forecasting.
Common scenarios
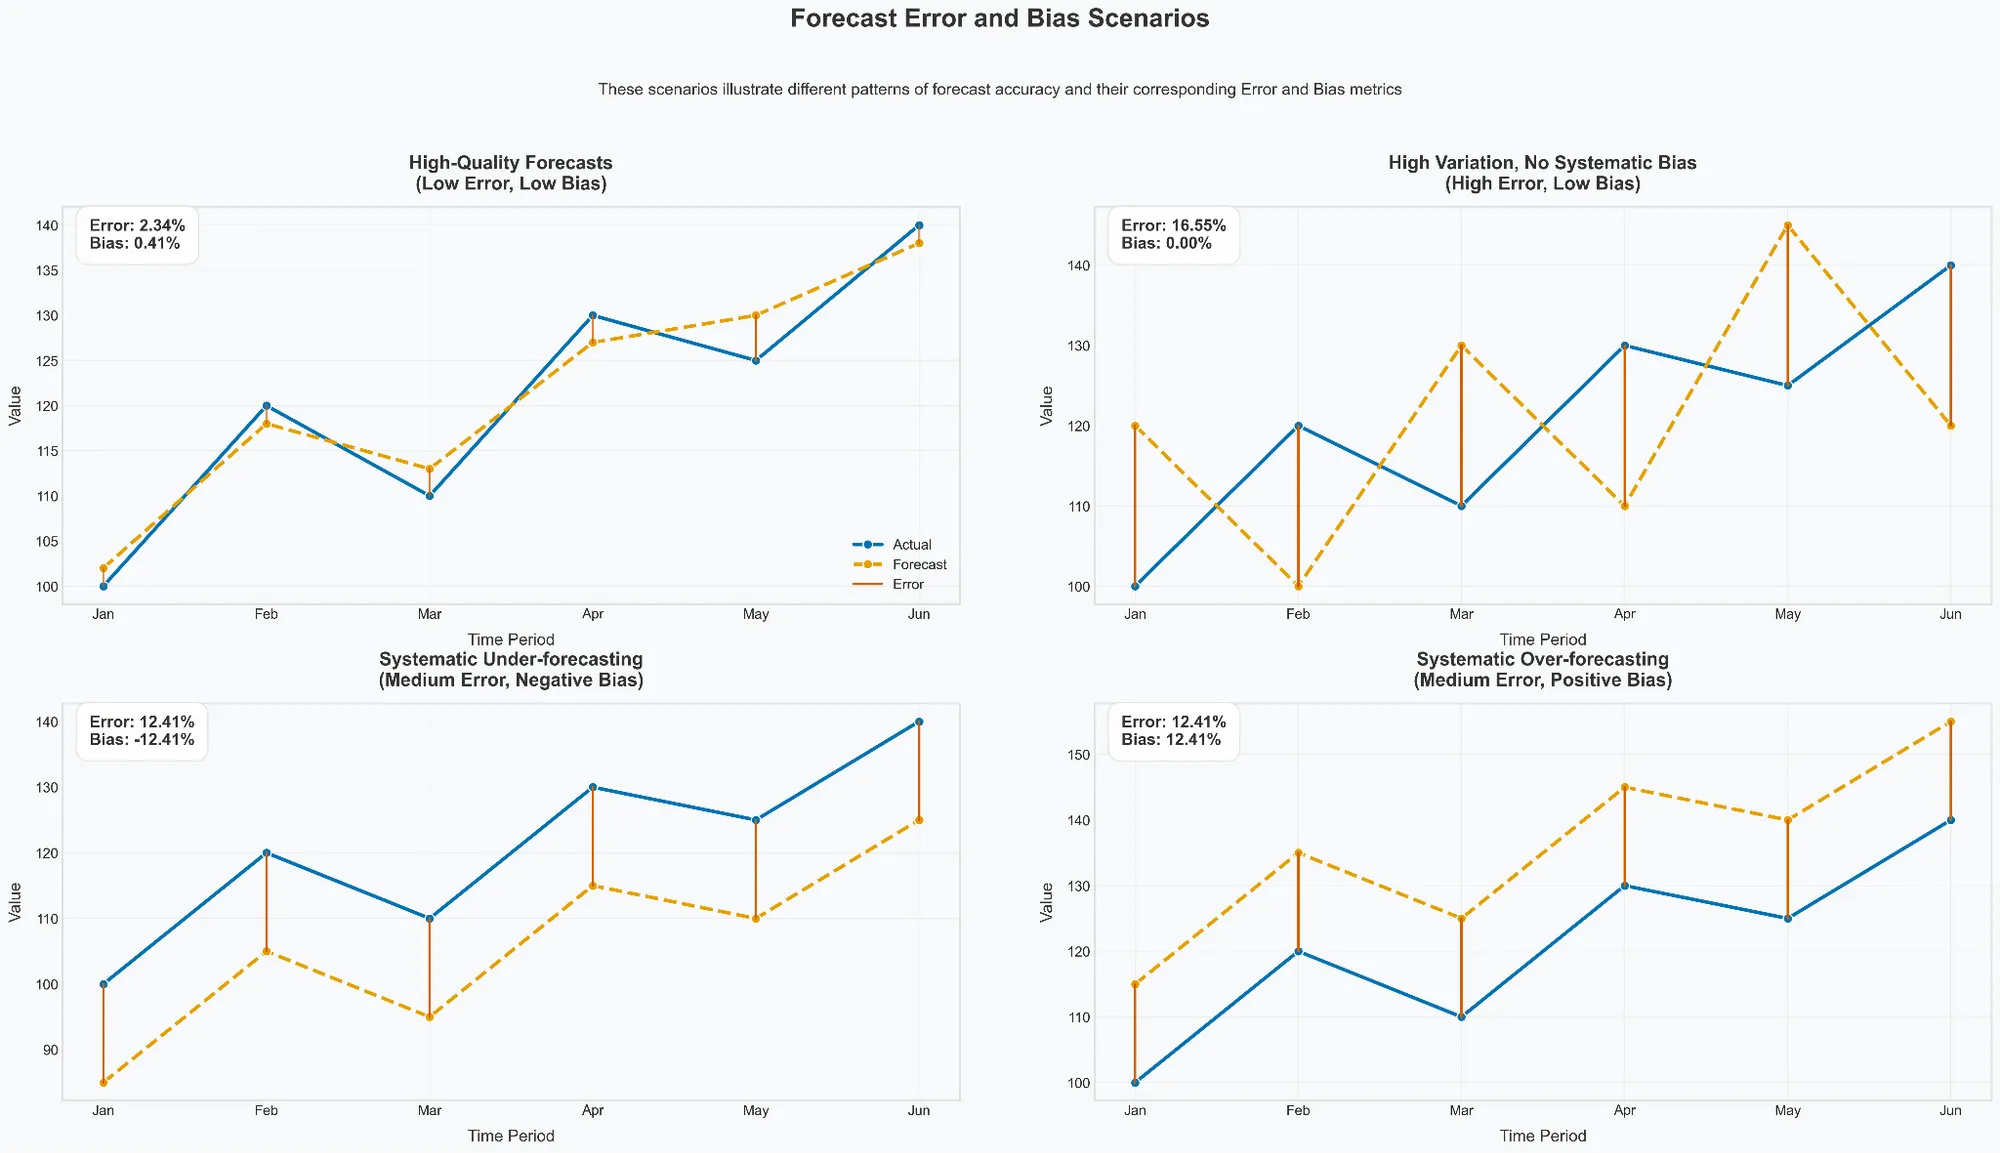
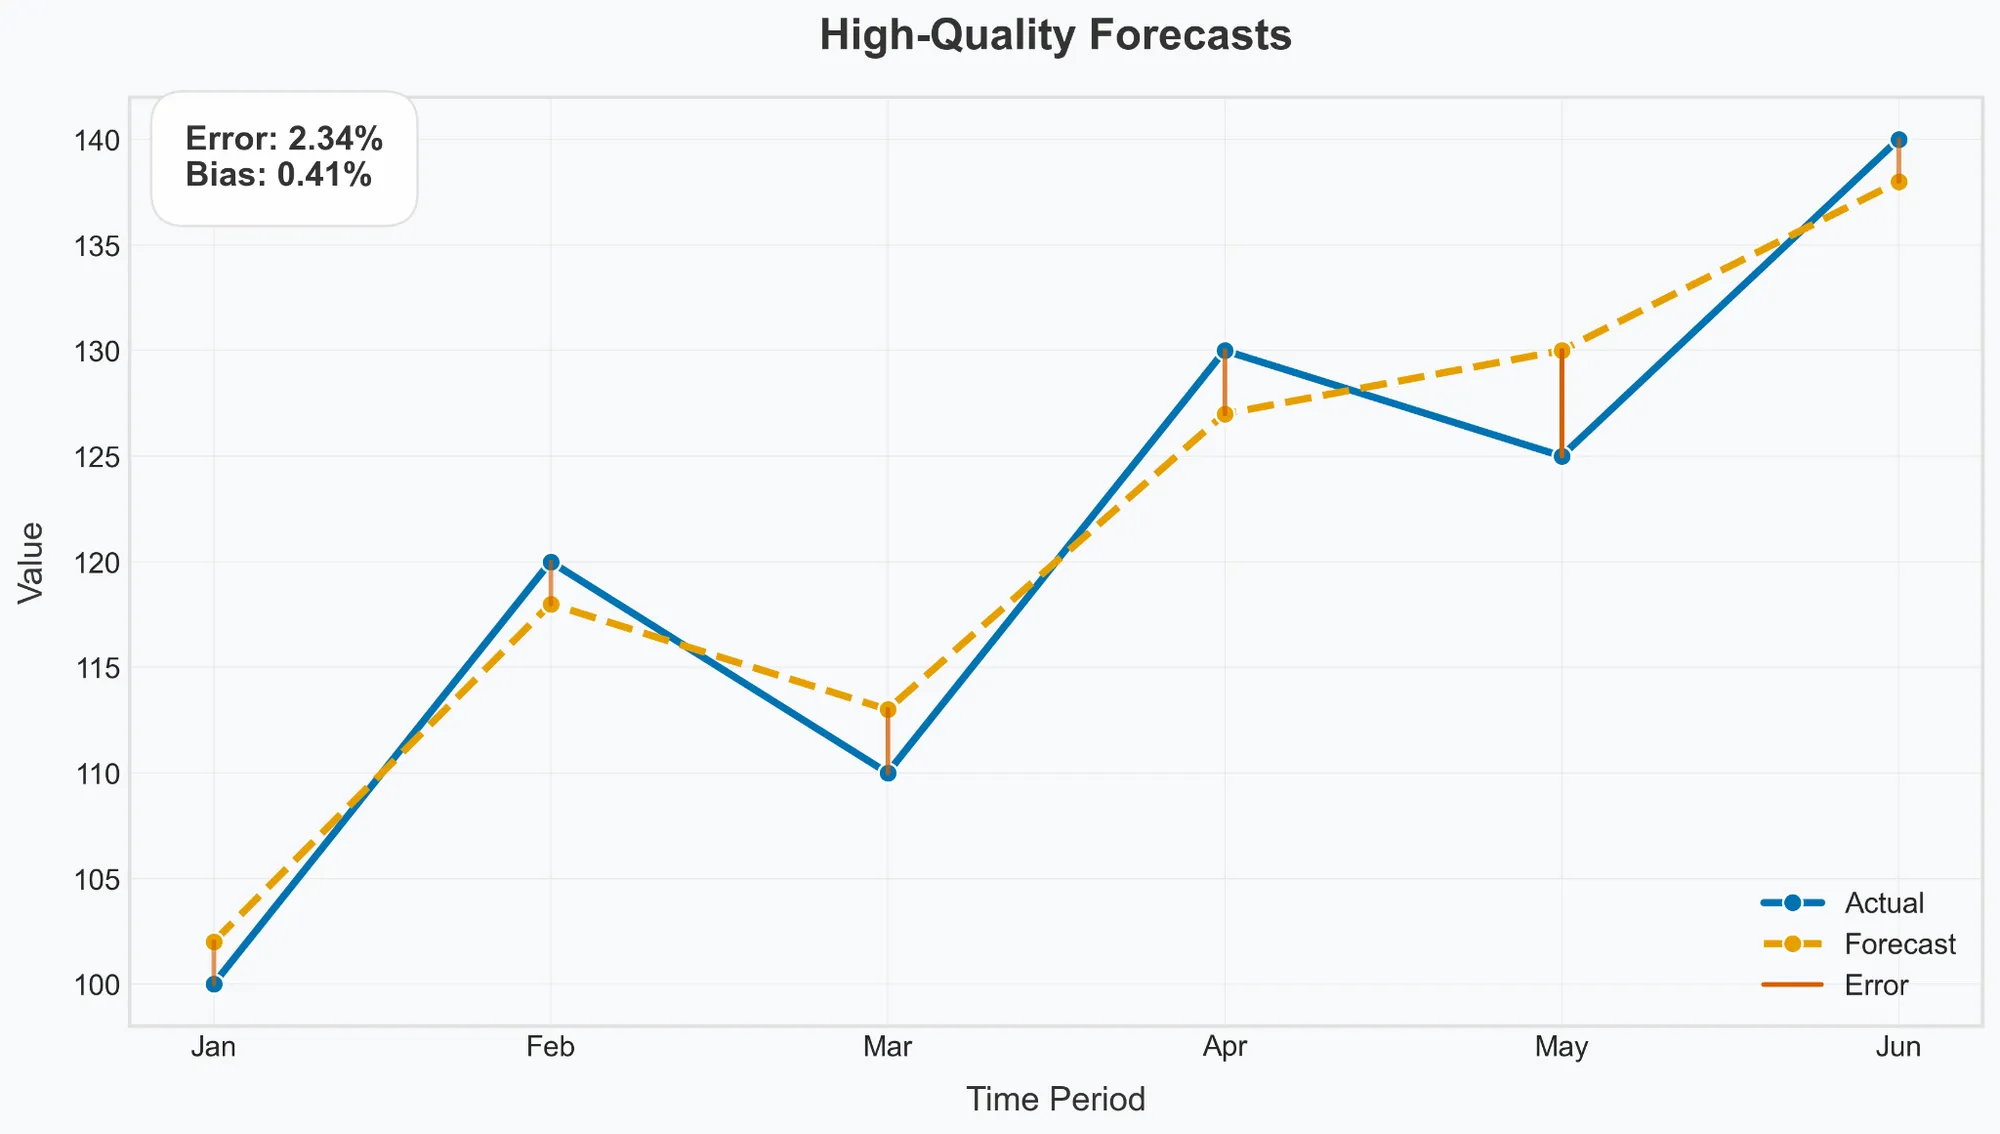
High-quality forecasts
- Interpretation: forecasts closely match actuals with no systematic direction.
- Business impact: reliable information for decision-making, optimal resource allocation.
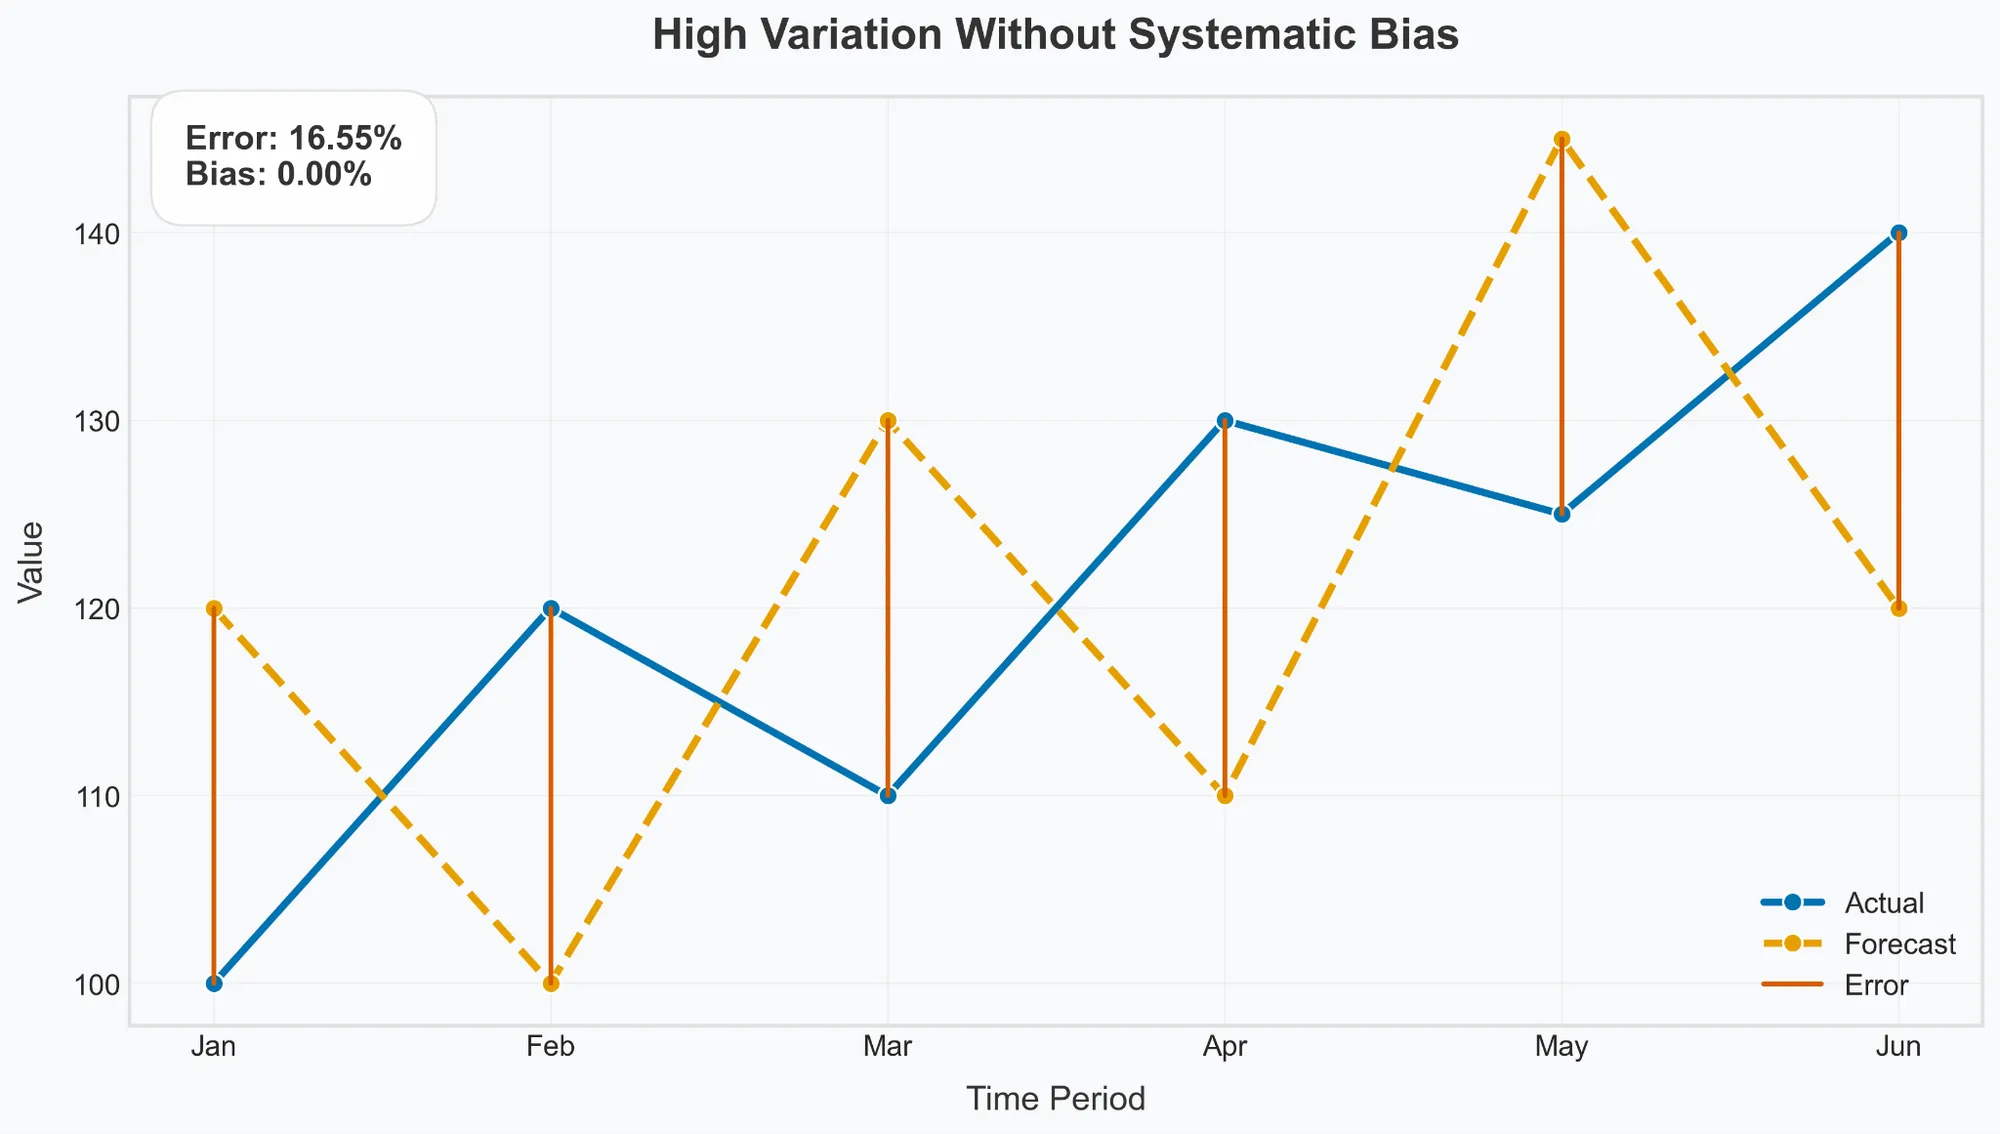
High variation without systematic bias
- Interpretation: large deviations that cancel out directionally.
- Business impact: poor predictability, but no systematic resource misallocation.
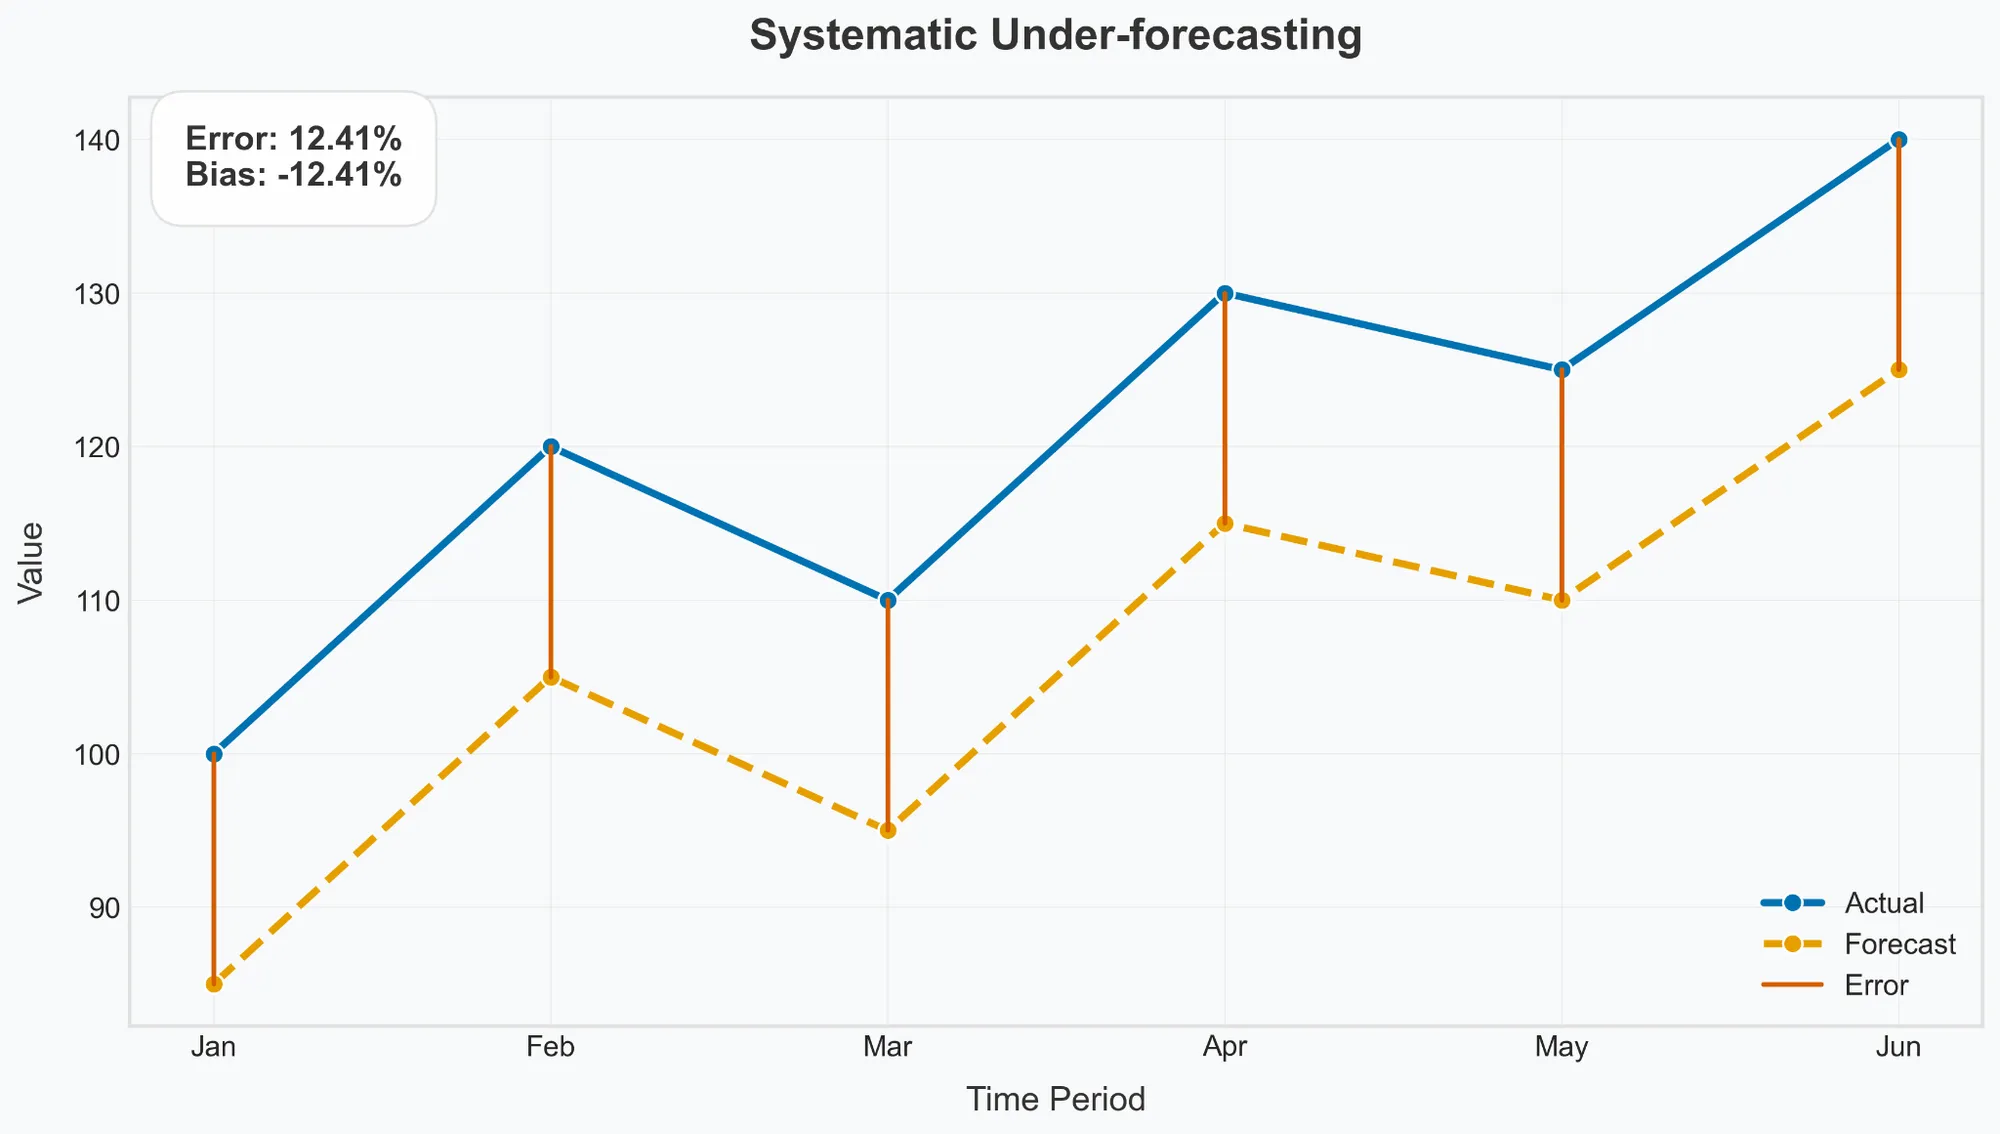
Systematic under-forecasting
- Interpretation: forecasts are consistently lower than actuals.
- Business impact: potential understaffing, stock shortages, or missed revenue opportunities.
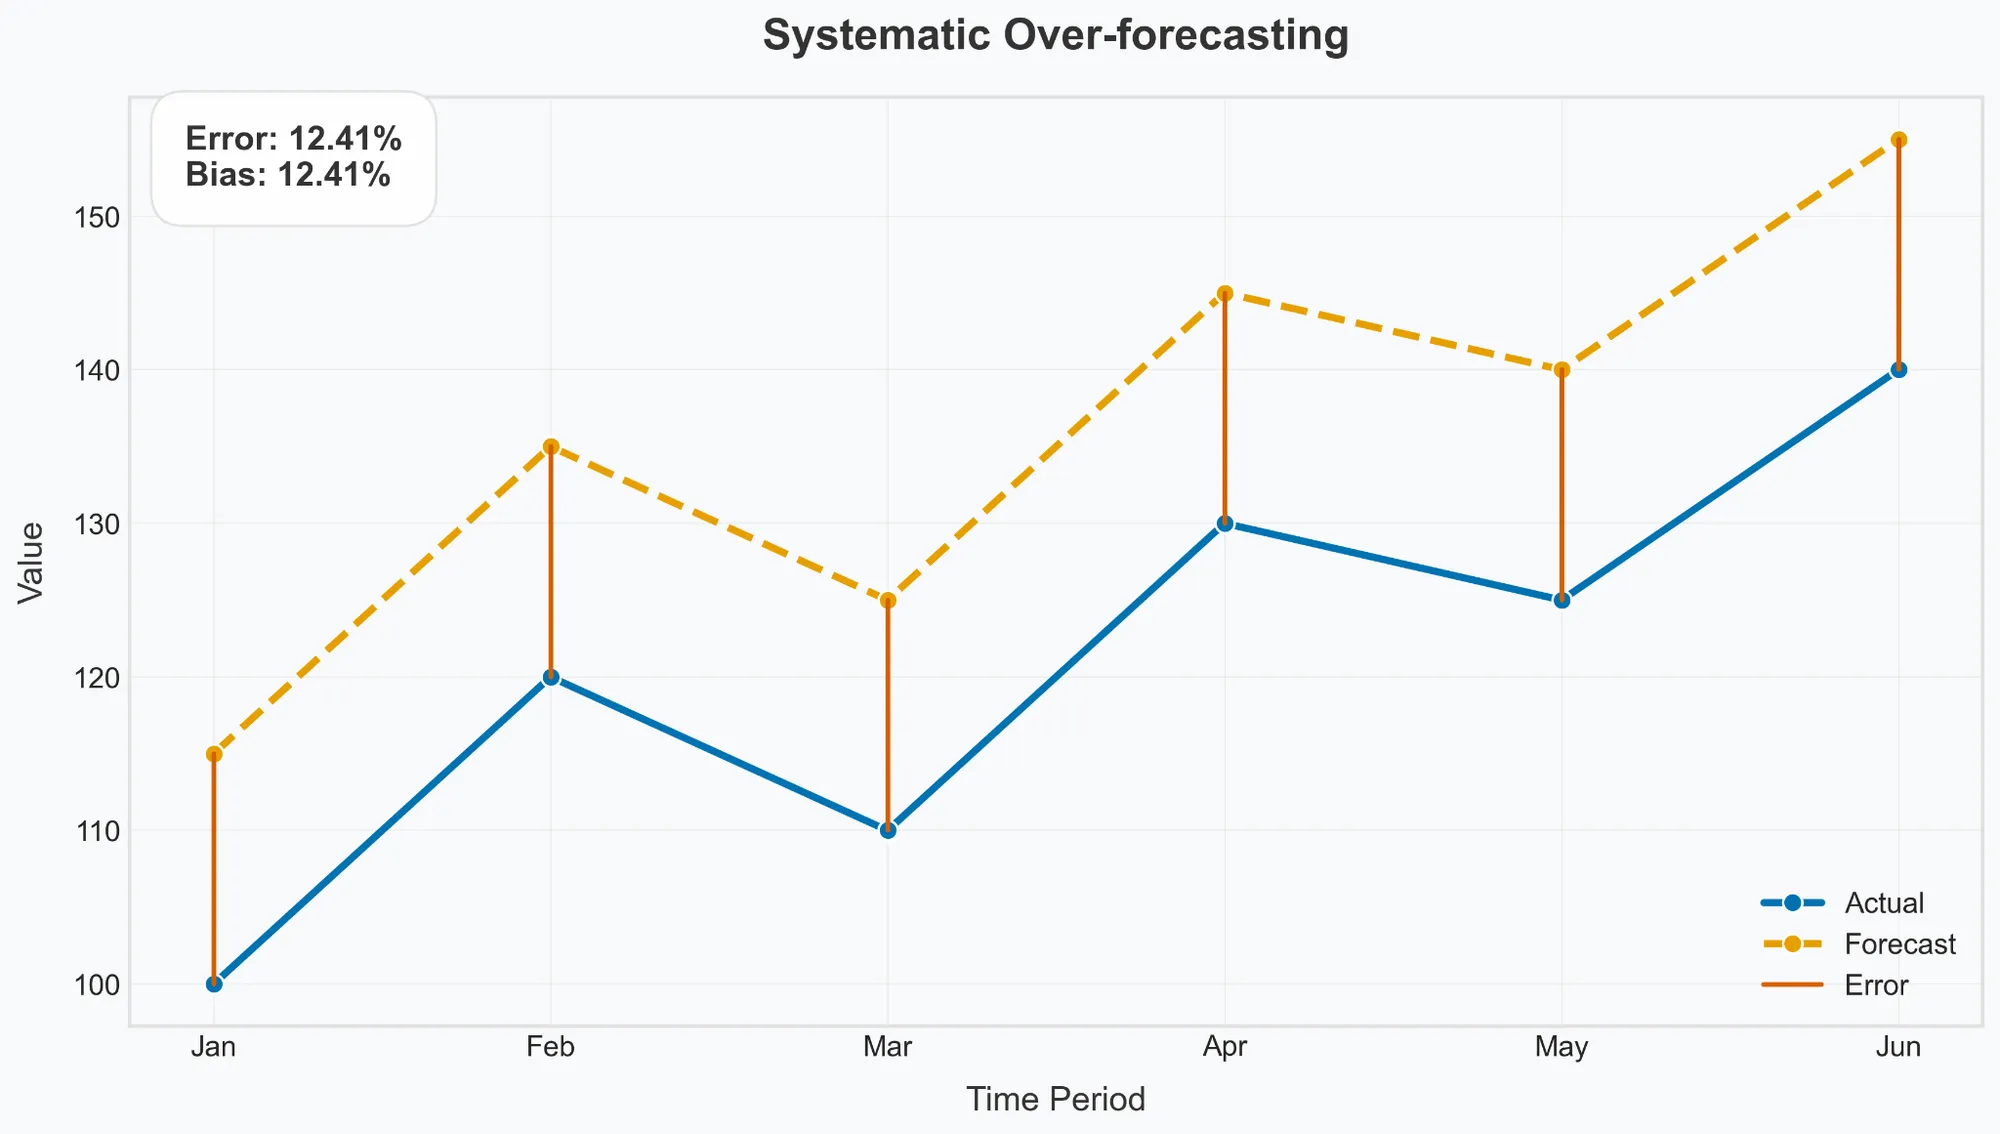
Systematic over-forecasting
- Interpretation: forecasts are consistently higher than actuals.
- Business impact: potential overstaffing, excess inventory, or inflated expectations.
Benchmarking forecast performance
Why benchmarks matter
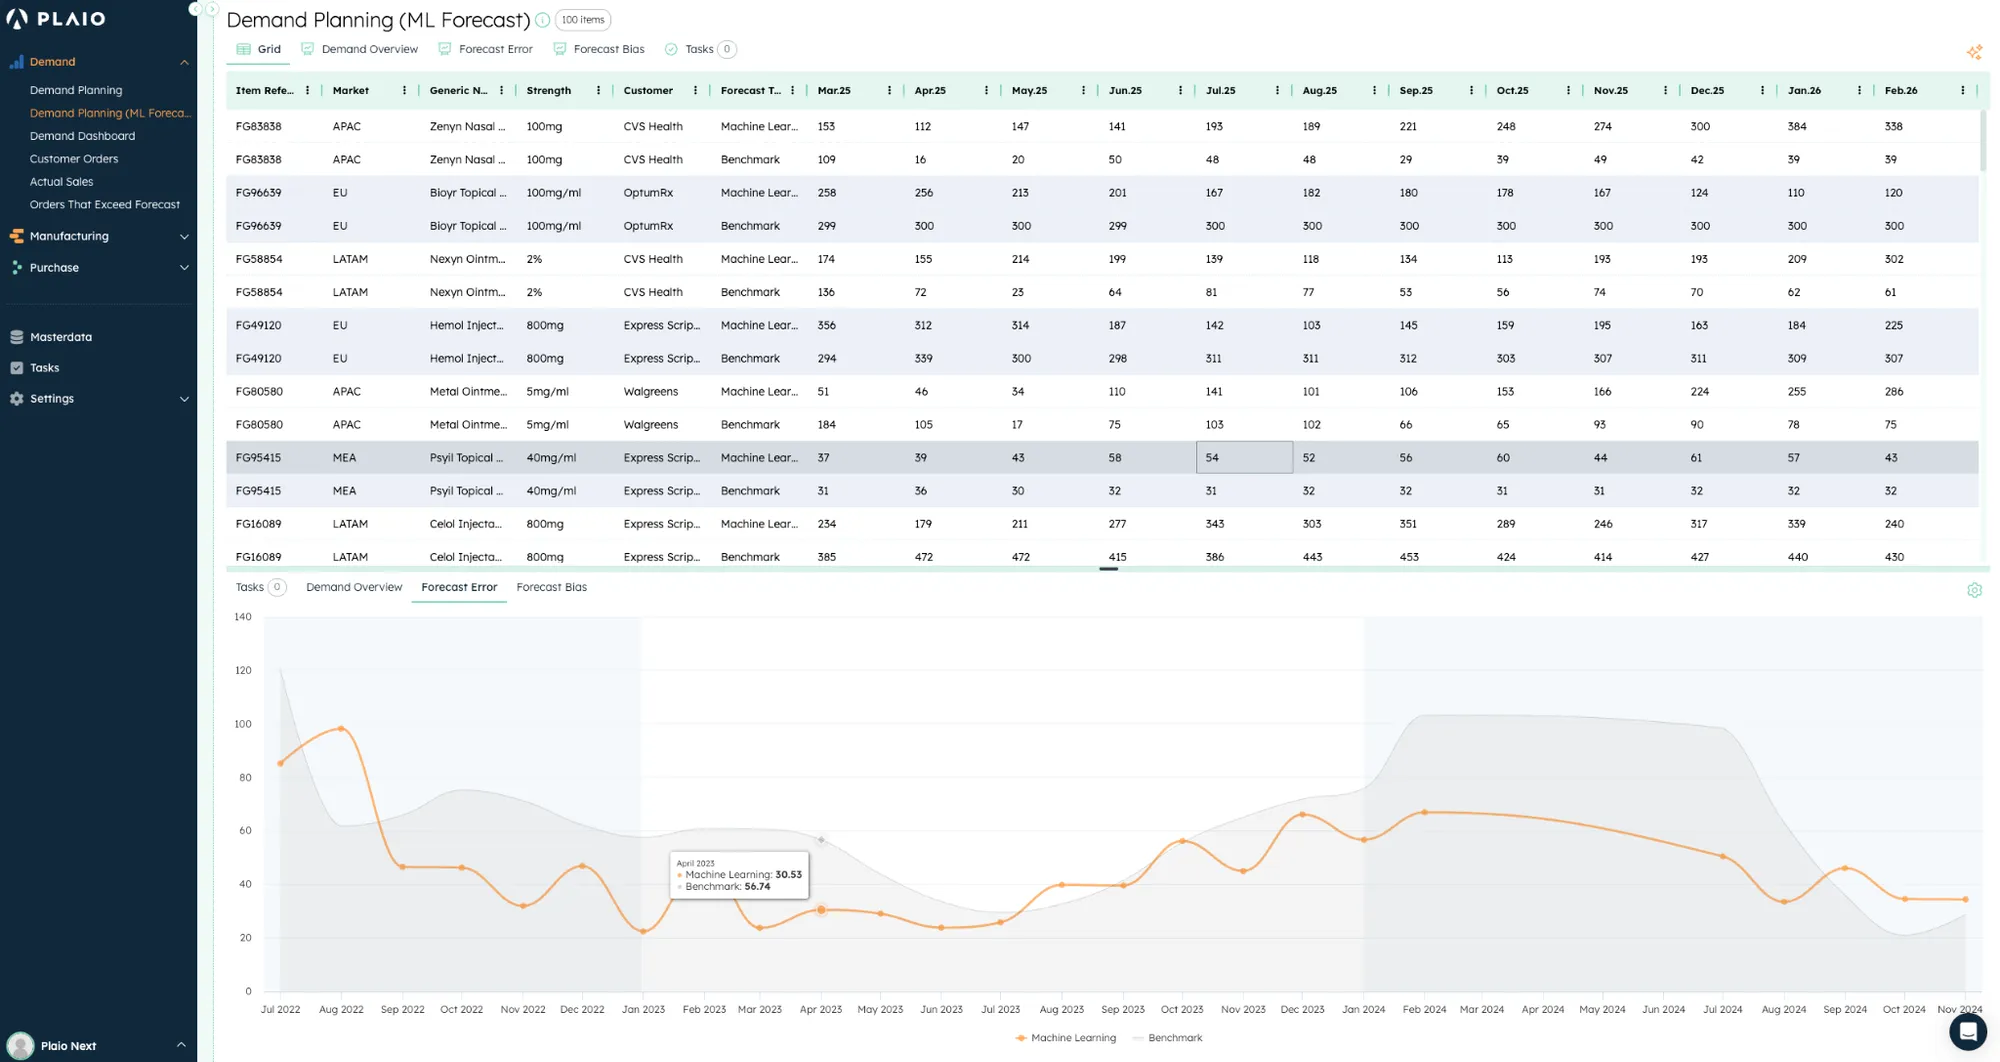
Evaluating forecast performance solely on absolute metrics like Error and Bias can be misleading without proper context. A forecast with a 30% Error might be considered poor in some contexts but excellent in others.
A benchmark forecast is a simple, easily implementable forecasting method that serves as a reference point for evaluating more sophisticated methods. PLAIO utilises a simple moving average.
Relative performance evaluation
The true value of Error and Bias metrics emerges when they are compared against benchmark forecasts:
- Contextualising performance: an Error of 60% might be excellent if the benchmark forecast has consistently shown 120% Error for the same items or periods.
- Identifying easy vs. difficult forecasts: for highly predictable items, even simple models might achieve 20% Error, making this level of performance merely average. In such cases, a good model would achieve less than 5% Error.
- Setting appropriate expectations: different product families, demand segments, or business units may have inherently different levels of forecast difficulty. Benchmarks help set realistic expectations for each.
Comparing ML, market, and benchmark forecasts
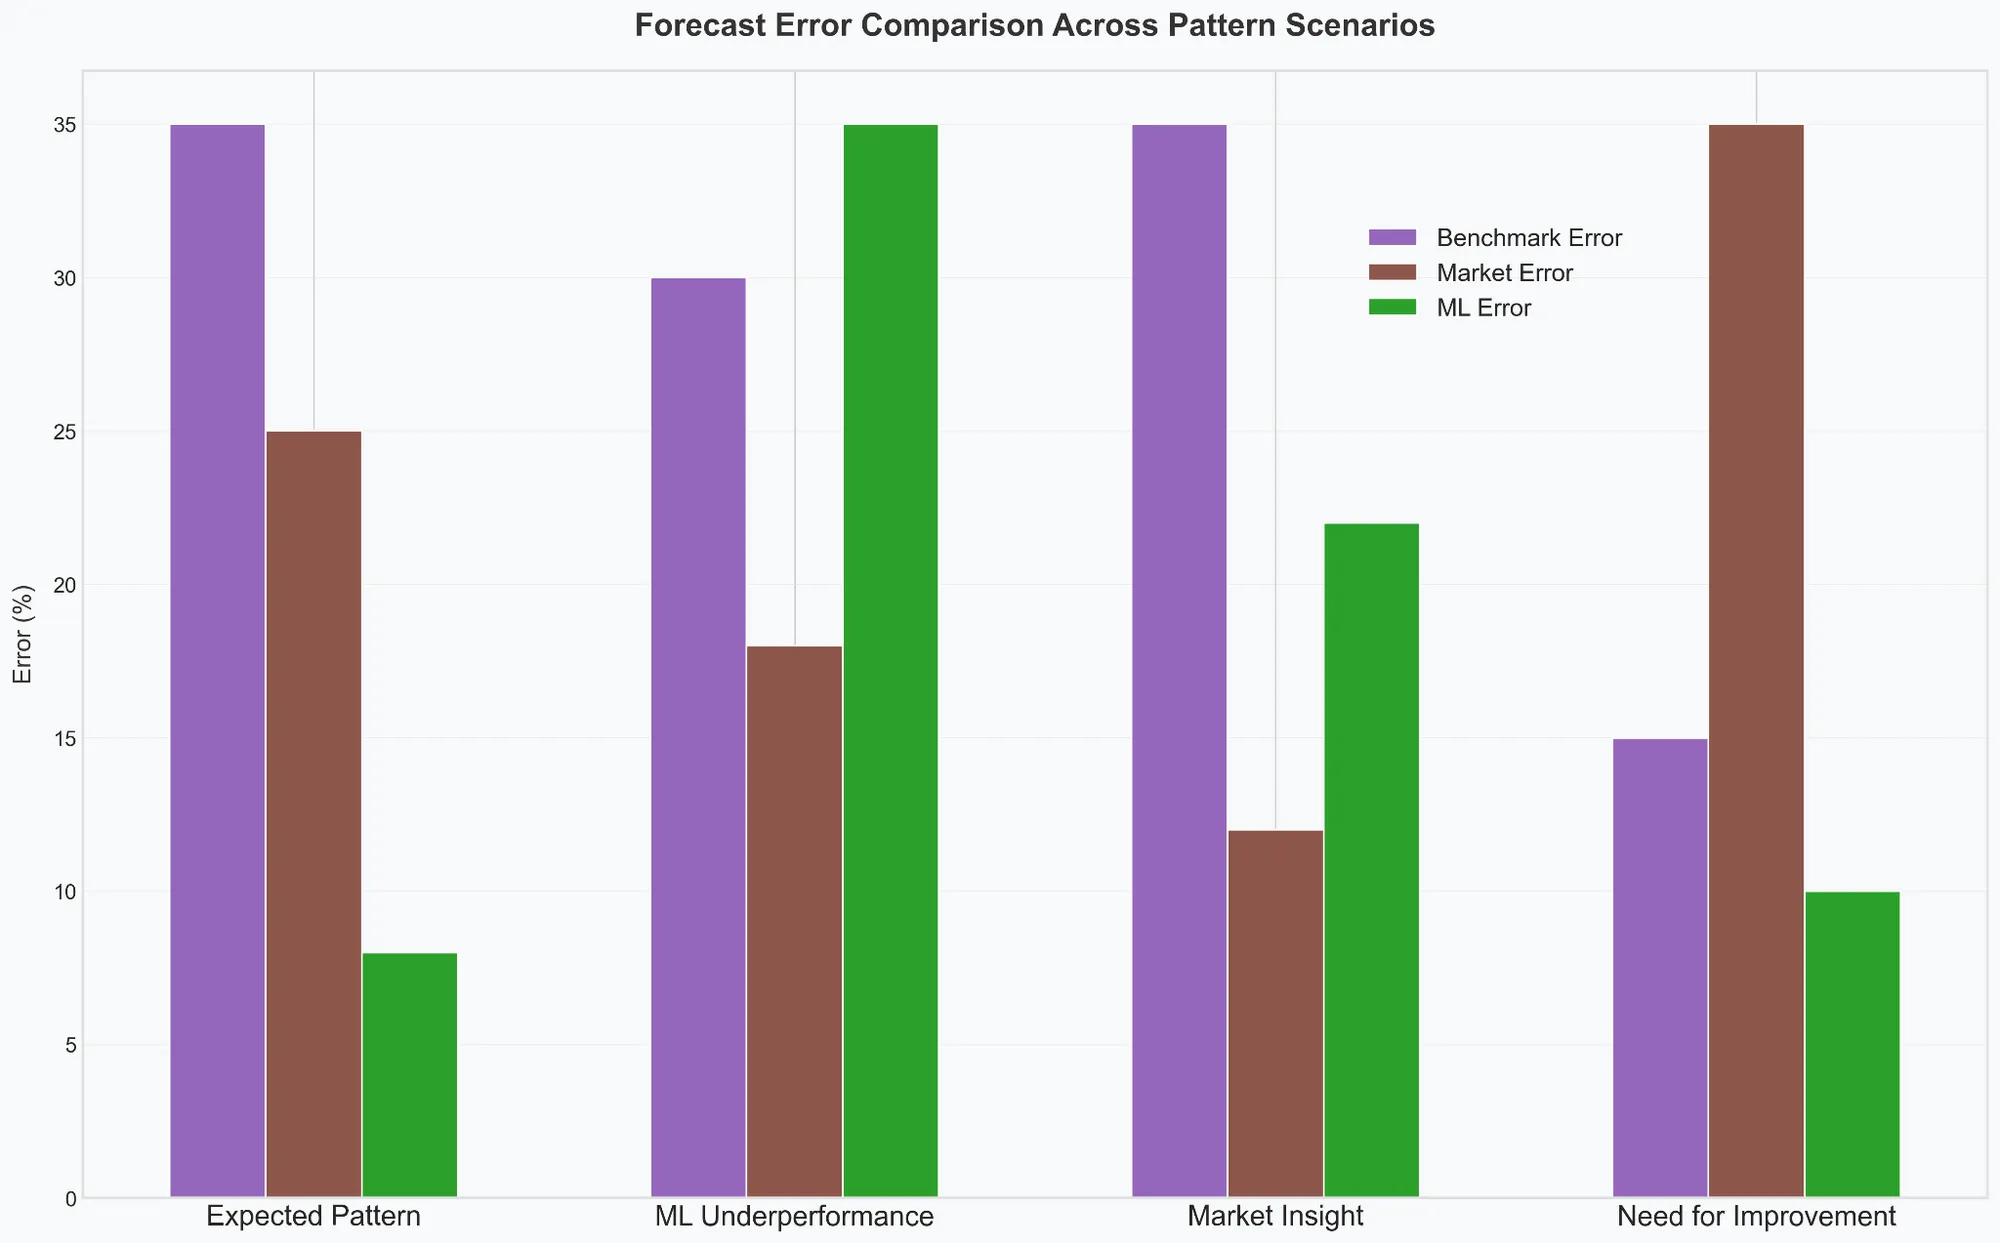
When evaluating multiple forecast types we typically expect ML forecasts to outperform market (manual) forecasts, which in turn outperform simple benchmarks. Several patterns can emerge:
- Expected pattern: ML < Market < Benchmark. Both human forecasters and ML models add value beyond simple methods.
- ML underperformance: Market < Benchmark < ML. ML model may be missing context or overfitting. Or market conditions are too novel for ML.
- Market insight: Market < ML < Benchmark. Sales teams or country managers have valuable nuanced insights. Document them; potentially incorporate into ML.
- Need for improvement: Benchmark < ML < Market. Market forecasts are worse than simple benchmarks. Better training, insights, or processes needed for human forecasters.
Leveraging benchmark comparisons
Organisations can use benchmark comparisons to:
- Target improvement efforts: focus on areas where forecasts significantly underperform benchmarks.
- Capture market insights: identify and learn from cases where market forecasts excel.
- Optimise forecast selection: potentially use different forecast types for different products or markets based on relative performance.
- Set realistic targets: establish achievable forecast error targets based on the demonstrated forecast difficulty of each item or category.
Can't find what you need? Email help@plaio.com and we'll get back to you within a few working hours.