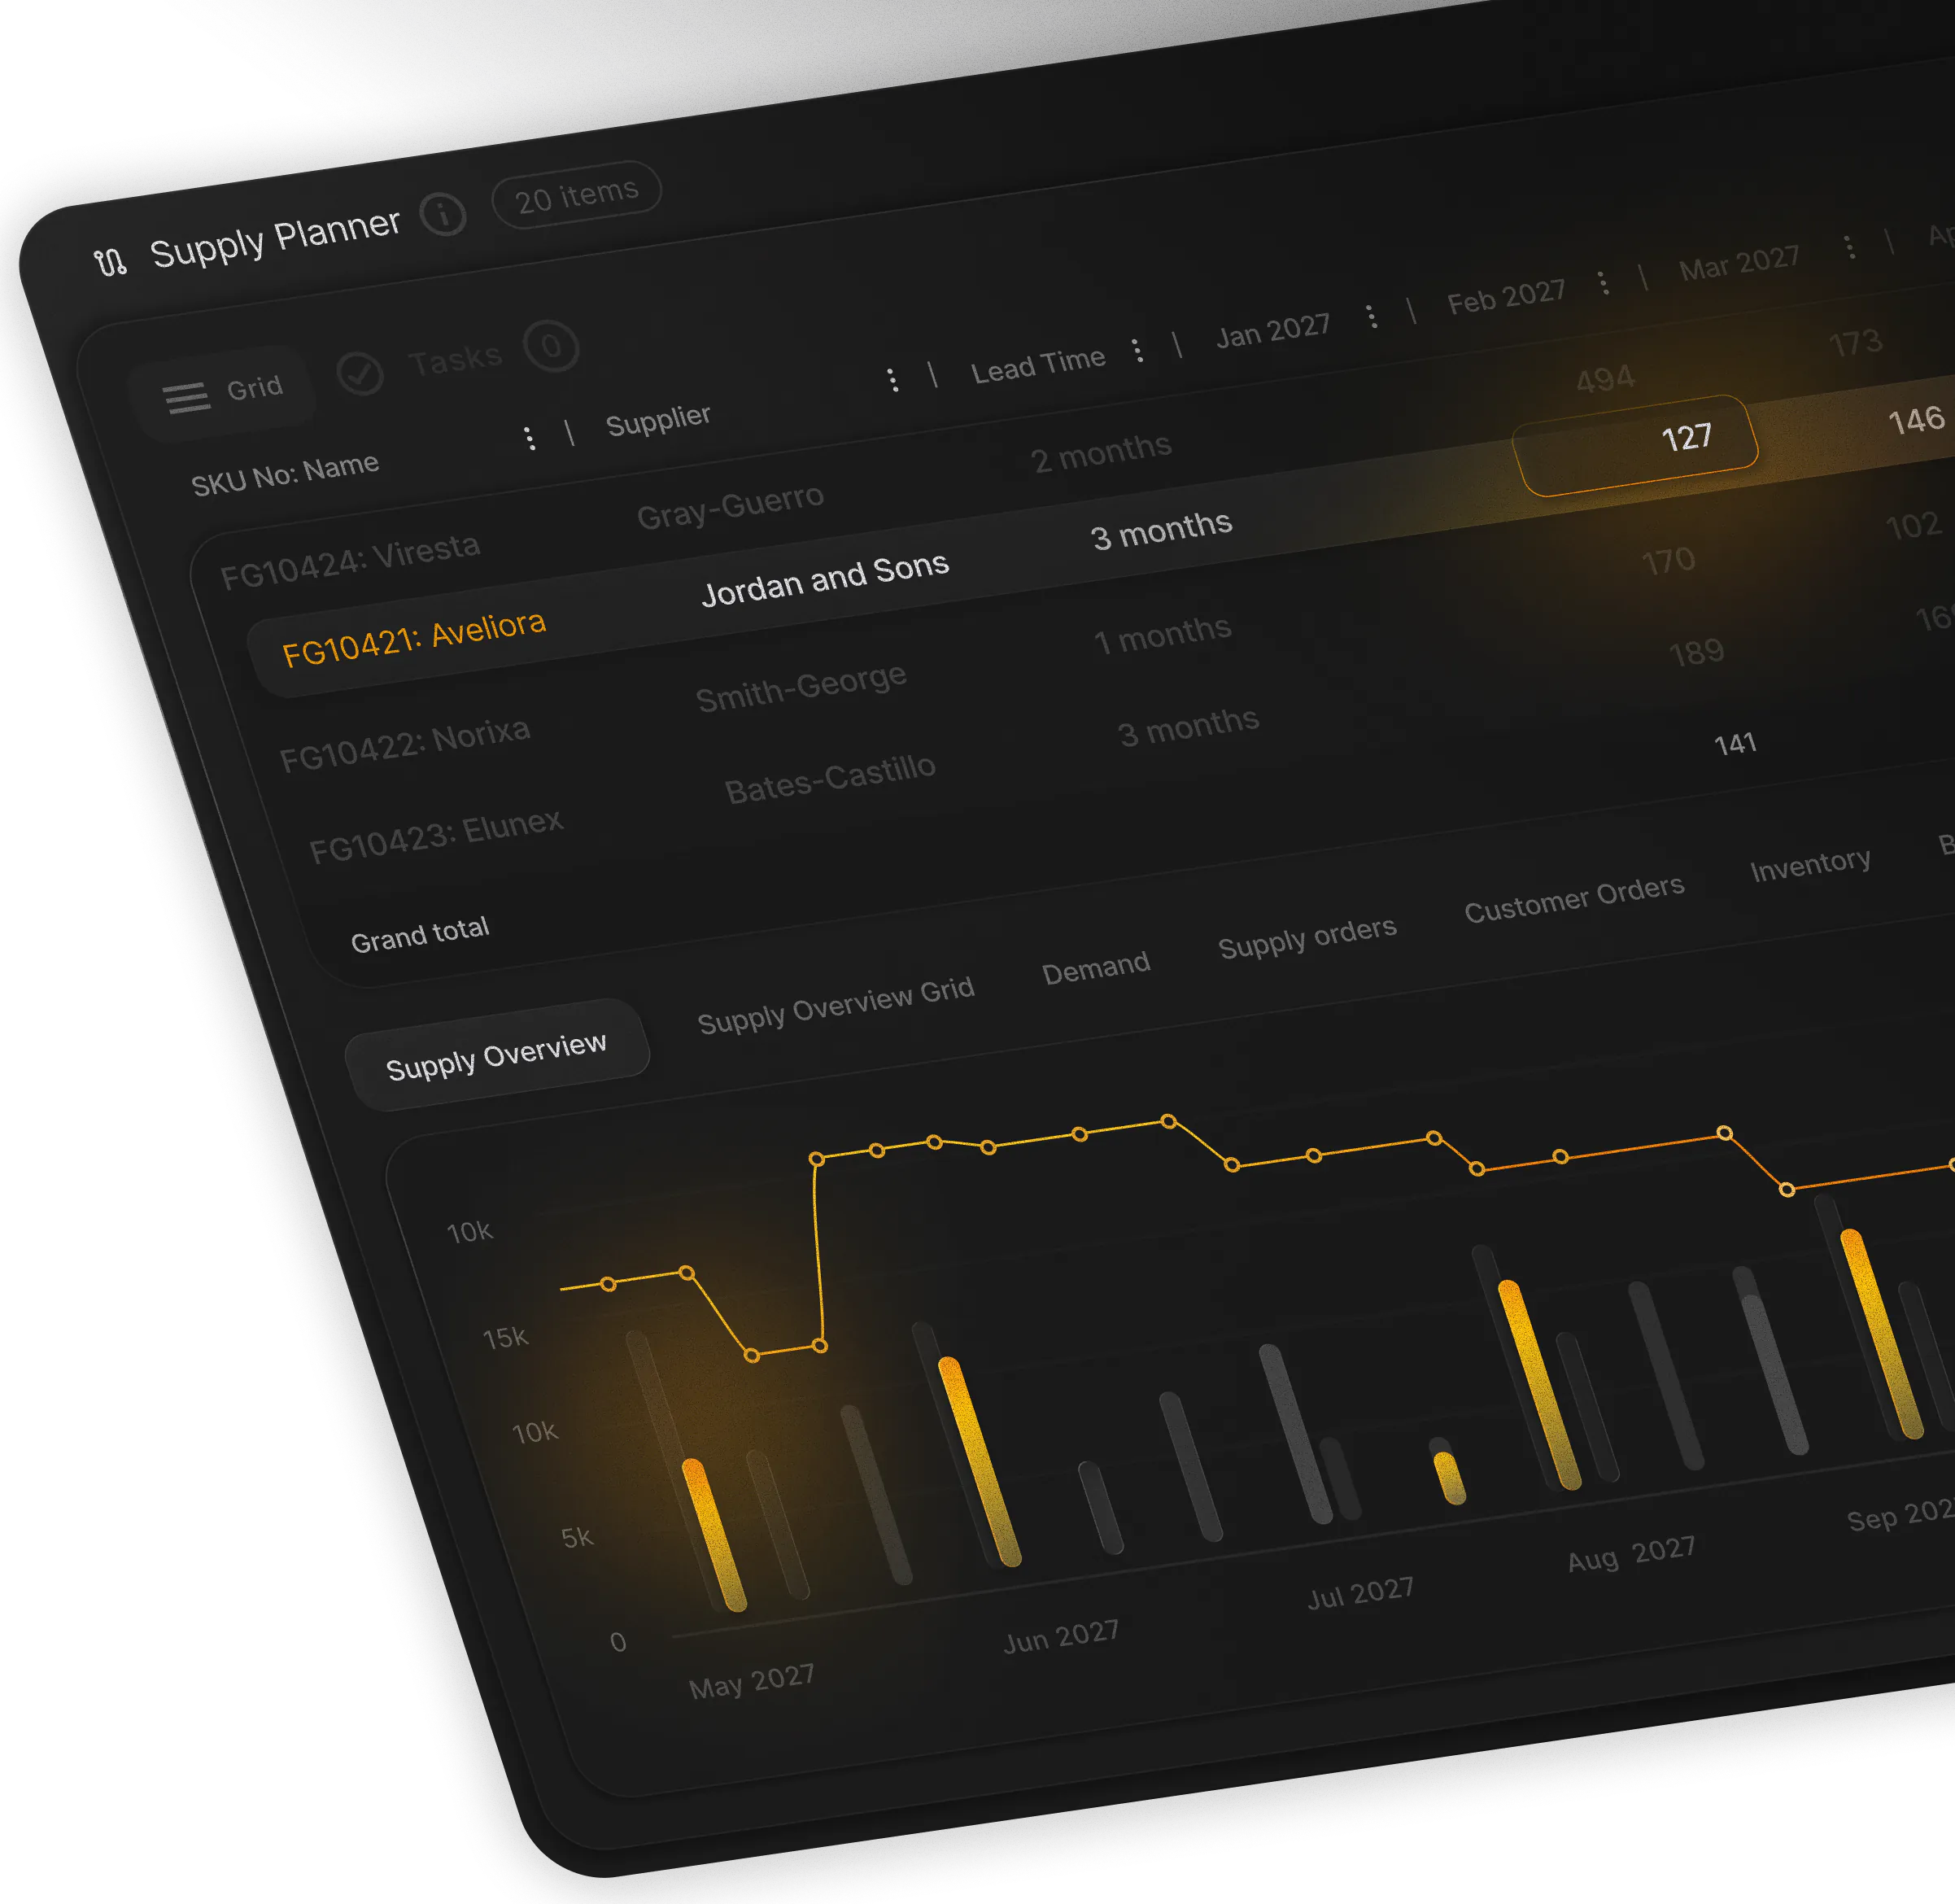


Instead of choosing a single, dogmatic method, I challenge teams to find the most stable “anchor” in their data and build the forecast from there. Think of it like building a house. You don’t start framing the walls on shifting sand; you pour a solid concrete foundation first. Your data anchor is that foundation. This is a practical, hierarchical process that starts with the most reliable, direct data you have and only escalates to more abstract, assumption-heavy models when necessary. The entire process relies on a solid foundation of data management to ensure you’re always working from a single source of truth, not a dozen conflicting spreadsheets.
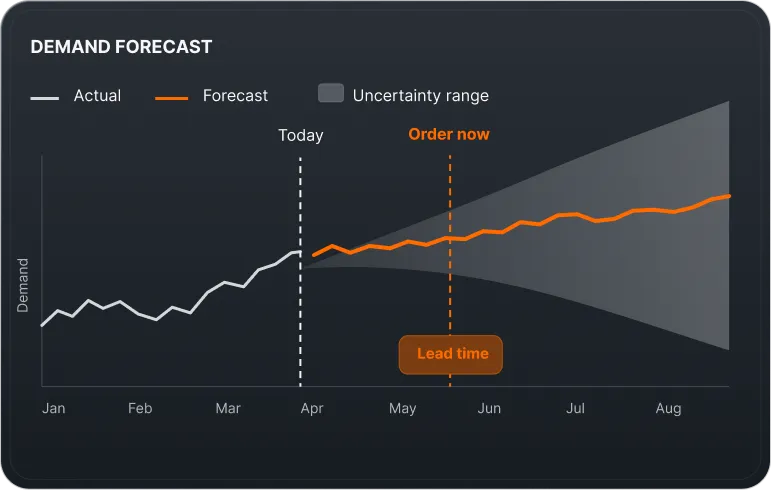
Step 1: Anchor on Brand Sales for In-Line Stability
Best For: In-line products in a stable market with at least 18-24 months of clean, consistent sales history.
How It Works: If your brand’s historical sales trend is stable and predictable, use it. Your own sales data is the most direct signal you have about patient and prescriber behavior. Don’t overcomplicate it. Use a statistical model to project the underlying trend forward as your baseline forecast. This approach is simple, fast, data-driven, and highly defensible. The crucial component here is a robust system of exception management that acts as your smoke detector, alerting you the moment reality starts to meaningfully deviate from this baseline. If this anchor holds, stick with it.
Concrete Example: Consider a mature dermatology cream for eczema that has been on the market for five years. It has a stable market share, predictable seasonality (higher demand in dry winter months), and consistent promotional patterns. Its own sales history is by far the best predictor of its future. The statistical baseline forecast becomes the trusted number, and the monthly S&OP discussion focuses on exceptions, like a new managed care contract win or a competitor’s short-term stockout, rather than debating the entire baseline from scratch.
Some will argue, “But our sales data is full of stockouts, one-off tender deals, and promotional noise.” This is a valid concern. A robust statistical model can and should be configured to automatically filter out or adjust for these events. However, if the underlying pattern remains too erratic even after these adjustments (if the signal-to-noise ratio is too low), it’s a clear indicator that this anchor is not stable enough. That is your cue to move up the hierarchy to Step 2.
Quick Checklist: Is Your Brand Sales Data a Stable Anchor?
- Do you have at least 18-24 months of consistent sales history (ex-factory or channel data)?
- Is the product in a mature, predictable market without major disruptive events on the horizon?
- Is your market share relatively stable (e.g., fluctuating less than 5% year-over-year)?
- Can you clearly identify and quantify past anomalies like stockouts or promotional lifts?
- After cleaning the data, does a statistical baseline show a Mean Absolute Percentage Error (MAPE) within your company’s acceptable forecast accuracy range?
If you can tick these boxes, anchor your forecast here. If not, it’s time to look for a more stable foundation.
Step 2: Anchor on Market Trends for Volatile Brands and New Products
Best For: Recent launches, products facing new competition, or brands with unstable sales in an otherwise predictable therapy class.
How It Works: If your brand’s sales are volatile but the overall market isn’t, take one step up in the hierarchy. This is a cornerstone of effective new product forecasting. Individual brand shares can fluctuate wildly due to marketing campaigns, new clinical data, or formulary changes. However, the total market volume for a condition (e.g., total prescriptions for hypertension) often grows at a much more predictable rate. For instance, while individual brands jostle for position, the global prescription drug market had a stable underlying growth of 9.2% in 2024[1]. Anchor your forecast on this more stable market trend.
The process is twofold: First, create a statistical forecast for the total market volume using syndicated data (like IQVIA, Symphony, etc.). This becomes the “size of the pie.” Second, forecast your brand’s market share as a separate input. This “size of your slice” is where the commercial team should focus their expertise and debate. This separation of concerns is a game-changer for consensus planning. The supply chain can now plan capacity and raw materials based on the more stable total market forecast, while Commercial, Marketing, and Finance can have a focused, productive argument about market share ambition and the activities needed to achieve it.
Concrete Example: Imagine launching a new GLP-1 agonist for type 2 diabetes. The overall market is growing at a strong and predictable 15% per year. Your new product, however, has only six months of sales history, and its market share swings wildly from 2% to 4% month-to-month as it fights for formulary access. Anchoring on your own brand sales would be a recipe for disaster. Instead, you anchor on the stable 15% market growth. The supply chain plans for a “most likely” market volume, while the S&OP debate centers on a clear question: “Do we believe our marketing plan will drive our share from 4% to 7% in the next six months, or is 5.5% more realistic?” This is a far more strategic conversation.
I know what you might be thinking: “Market data is expensive and not always perfect.” You’re right. But the cost of a chronically unstable forecast is far higher: excess inventory, stockouts that contributed to a record high of 323 active drug shortages in early 2024[2], and eroded business trust. Investing in a stable market-level view provides an essential external benchmark that internal sales data alone cannot. For the wider picture those benchmarks sit in, we keep a running database of 152+ pharma supply chain statistics covering shortages, sourcing, cold chain and AI adoption.
Quick Checklist: When to Anchor on Market Trends
- Is your own brand’s sales history too short (less than 18 months) or too volatile to be reliable?
- Does your product compete in a well-defined, measurable therapy class or market?
- Is the total market volume more stable and predictable than your individual brand’s sales?
- Are you facing significant market events (e.g., new competitor launch, loss of exclusivity) that will directly impact your share but not necessarily the total market size?
- Do you have access to reliable third-party market data?
Step 3: Anchor on Epidemiology for New Frontiers and Launch Forecasting
Best For: Pre-launch products, drugs for rare diseases, or major market disruptions (like a new mechanism of action) where no relevant sales history exists.
How It Works: When you have no direct sales data and no comparable market, a patient-based epidemiological model is your only logical starting point. This is the ultimate top-down approach. You start with the total patient population and systematically narrow it down through the treatment cascade to arrive at your addressable market and projected patient count. A typical cascade looks like this:
- Total Population (e.g., a country’s population)
- Prevalence/Incidence (Number of people with the disease)
- Diagnosed Population (% of patients who are actually diagnosed)
- Treated Population (% of diagnosed who seek and receive treatment)
- Eligible for Your Drug (% of treated patients who meet the label criteria)
- Your Patient Share (Your target market share of eligible patients)
Skeptics will rightly point out that these models are built on a pyramid of assumptions, where a small error at the top (e.g., a 2% error in prevalence) can cause a massive miss at the bottom. This is true. The purpose of an epi-model isn’t to be a crystal ball; it’s to provide a transparent, logical framework for your launch plan. This structured thinking is critical when the top 20 pharma companies reinvest 22.5% of their prescription drug sales back into R&D[1] and need to justify that investment. The absolute key is that this must be a living model. As soon as you launch, you must relentlessly pressure-test and update these assumptions against real-world data like new prescriptions (NRx) and patient adherence rates. An effective planning platform lets you do this quickly and instantly see the cascading impact on your end-to-end supply plan.
Concrete Example: You are launching a new gene therapy for a rare genetic disorder affecting 50,000 people in the US. There is no existing market. Your epi-model assumes 80% are diagnosed (40,000), 50% are treated at specialized centers (20,000), and you project capturing a 10% patient share in year one (2,000 patients). This becomes your launch forecast anchor. In the first month post-launch, you track actual patient starts. If you only see 100 new patients instead of the expected ~167 (2000/12), you don’t wait. You immediately investigate. Is the issue a lower-than-expected diagnosis rate? Are physicians reluctant to prescribe? This real-world data allows you to revise your “patient share” or “treated population” assumption down for the next S&OP cycle, adjusting the supply plan before you build millions in excess inventory.
The Right Technology for Modern Pharma Forecasting
But isn’t Excel good enough? It’s flexible and everyone knows it. While true for simple tasks, for anchor-based pharma forecasting, spreadsheets become a dangerous liability, especially when 36% of healthcare leaders identify supply chain disruptions as their top challenge[3]. They create data silos, lack version control (leading to the dreaded “Forecast_v4_FINAL_use_this_one (4).xlsx” problem), make scenario comparison a nightmare, and simply can’t scale. This flexible, anchor-based approach is impractical to execute consistently in spreadsheets. At COTY, my team spent 80% of our time wrangling data in Excel and only 20% analyzing it and making decisions. Your forecasting software shouldn’t dictate your strategy. To properly implement the Anchor Framework, your demand planning platform must be built on three pillars:
- Complete Demand Transparency: Everyone, from the brand manager to the supply planner, must see the exact data and assumptions driving the forecast. When a number is challenged, you need to be able to instantly click down from the final forecast number to the statistical baseline, the market share assumption that was applied, and any event uplifts. This transparency, logged and auditable, is the bedrock of trust and better consensus.
- Flexible Scenario Planning: The business environment is dynamic. The system must let you easily switch between anchor points and model risks and opportunities in minutes, not days. What if a competitor launches six months early? What if new clinical data drives a 5% share gain? What if your CMO faces a production delay? You need the ability to model these scenarios, compare their financial and operational impacts side-by-side, and make a decision. This is where modern AI and ML capabilities are a game-changer, with studies showing machine learning models can improve pharmaceutical demand forecasting accuracy by 10-41%[4] over traditional baselines.
- Intuitive Simplicity: Complex “black box” models erode trust and adoption. If the commercial team doesn’t understand where the number comes from, they won’t own it. The goal is a forecast that is as simple as possible, but no simpler. A visual, intuitive platform, like the one we’ve built at PLAIO, makes even the most complex multi-level forecast intuitive and understandable, encouraging collaboration rather than confusion.
Furthermore, your forecast is useless if it isn’t seamlessly connected to a system that understands the real-world pharma constraints of shelf-life, batch sizes, regulatory approvals, and complex CMO relationships. Without seamless integrations into your ERP and other core systems, your forecast remains an academic exercise, dangerously disconnected from operational reality.
Stop Debating Methods, Start Aligning on Anchors
The most effective forecasters I know are pragmatists, not dogmatists. They don’t adhere to a single methodology; they use a flexible, hierarchical approach, anchoring their forecast on the most stable and defensible data point available at that time. When I joined the craft e-tailer Hobbii, it was in a period of explosive, near-unpredictable growth. We couldn’t trust our own volatile brand sales history. Instead, we found that the overall online craft yarn market trend was surprisingly stable. So, we anchored our entire business plan there. We created a solid forecast for the total market, and then had intense, productive debates about our market share assumptions. It transformed the conversation from a blame-filled “your number is wrong” to a strategic “are we all aligned on our ambition and the plan to achieve it?”
The next time you’re in a forecasting meeting that’s going in circles, stop the argument about top-down versus bottom-up. Reframe the conversation. Put the hierarchy on the whiteboard (Brand Sales, Market Trends, Epidemiology) and ask the only question that matters: “Where is our most stable anchor point for this product, at this stage in its lifecycle?” Answering this question is the foundation of a robust pharma forecasting process. It creates a forecast the entire business can finally trust and execute against, ending the cycle of fire-drills and shortages that has seen the average drug shortage duration balloon to a staggering 1,202 days[2].
References
- “2024 Pharma Statistics.” Hardman & Co, 3 April 2025. https://hardmanandco.com/wp-content/uploads/2025/04/250403-Hardman-Co-Insight-2024-Pharma-Statistics.pdf
- “Pharma Supply Chain Disruptions: How Are Drug Shortages Impacting the Market? Latest Stats.” PatentPC. https://patentpc.com/blog/pharma-supply-chain-disruptions-how-are-drug-shortages-impacting-the-market-latest-stats
- “Healthcare Supply Chain Statistics.” XS Supply. https://xs-supply.com/blogs/metrices/healthcare-supply-chain-statistics?srsltid=AfmBOooievy4lLkINtn58GKXNZi2V0I2fb5ezNlVIxtKQIkejF-4gAdG
- “Machine learning models can improve pharmaceutical demand forecasting accuracy by 10-41% over traditional baselines.” Nature Scientific Reports. https://www.nature.com/articles/s41598-026-35113-4