Pharmaceutical forecasting software with accuracy you can see
The statistical forecast, the commercial plan and the tender usually live in three files that someone merges by hand. PLAIO puts them in one forecast, scores it against actual sales, and supply plans on the result.
See a few of your SKUs forecast in PLAIO
30 minutes with PLAIO. Bring a few SKUs and the forecast file you work from today.
Leading pharmaceutical companies






Your forecast is three files and a merge
In most pharma planning teams the statistical forecast sits in one file and the commercial plan in another. The tender arrives by email. Someone combines them by hand every cycle.
When that merge goes wrong, you find out later, as a stockout or a write-off.
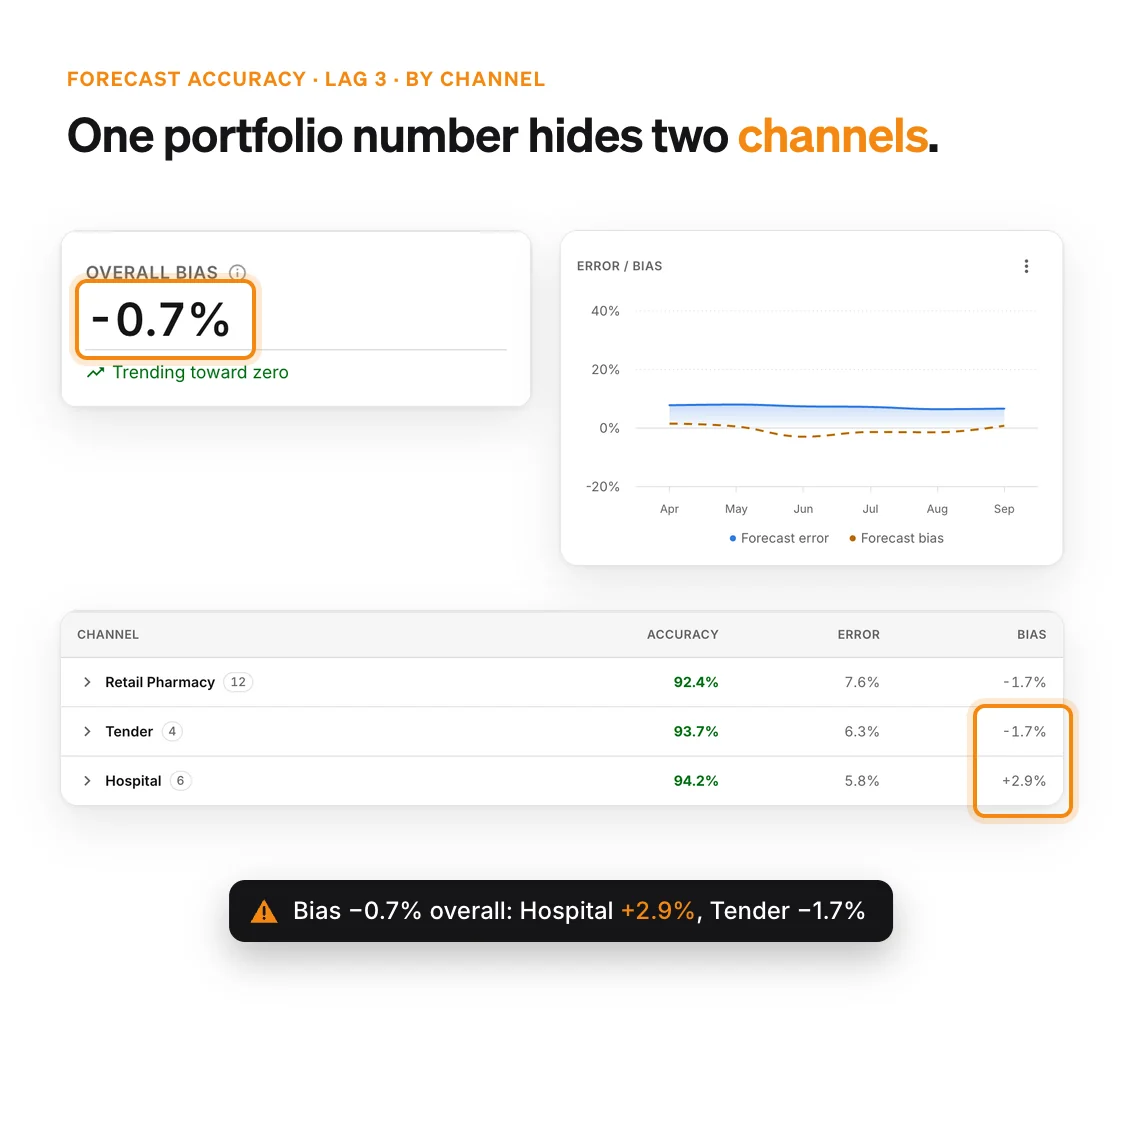
One portfolio number also hides a lot. A bias of −0.7% looks like a team doing its job. Cut by channel, it can be +2.9% on hospital and −1.7% on tender: errors cancelling out, and none of them gets fixed.
Then S&OP asks what changed since last month, and why. The answer is in someone’s sent folder, if it was written down at all.
Why it matters:
A cleverer model on its own won’t solve this. Every input needs to land in one place where it is combined, saved as a version and checked against what sold. Supply should plan on that number and nothing else.
What your forecast gets in PLAIO
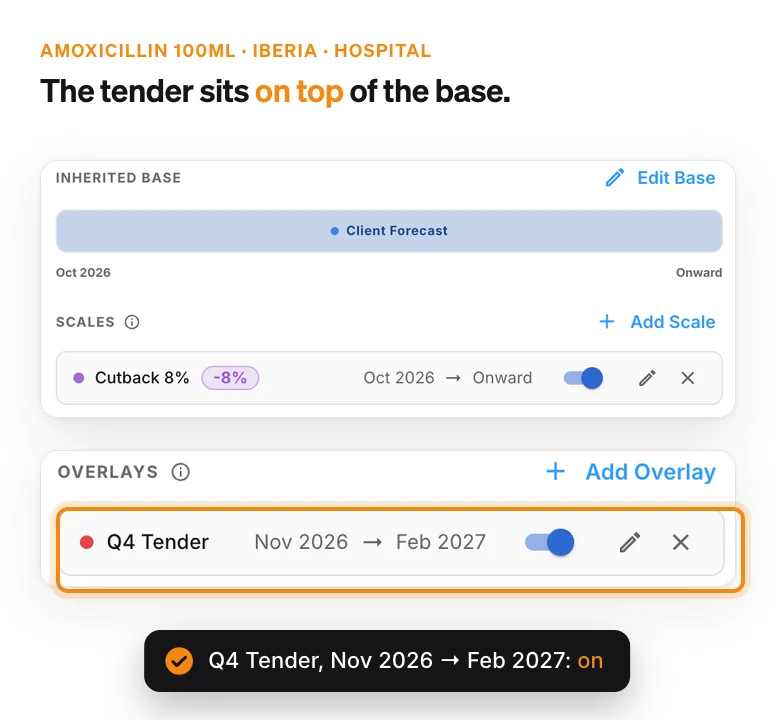
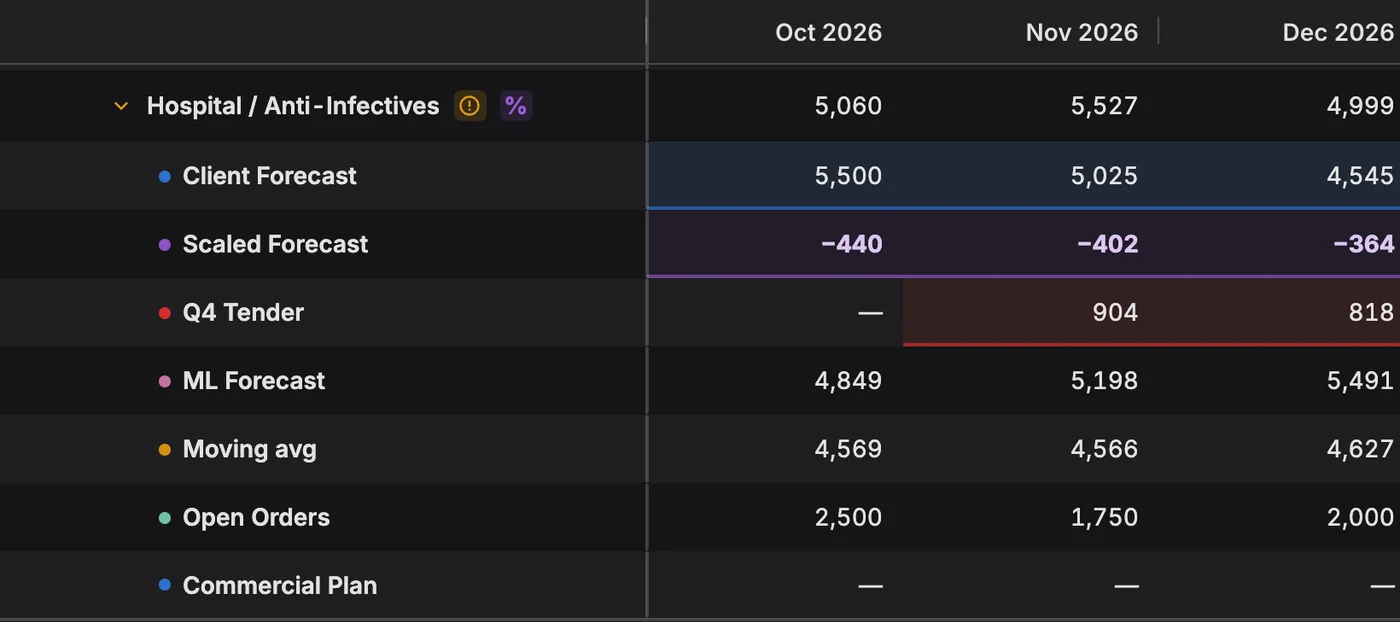
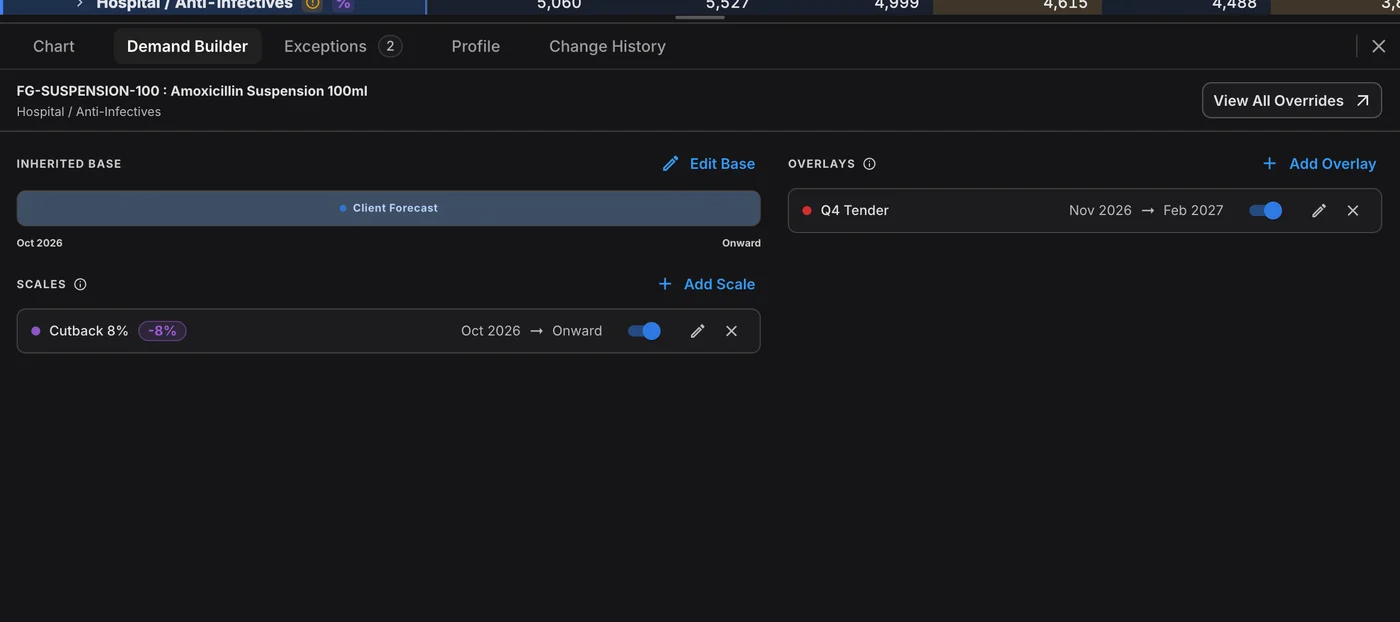
Tenders and launches as overlays
A tender gets its own line on top of the base, for the months it covers. Lose it and you switch the line off. The baseline was never touched.
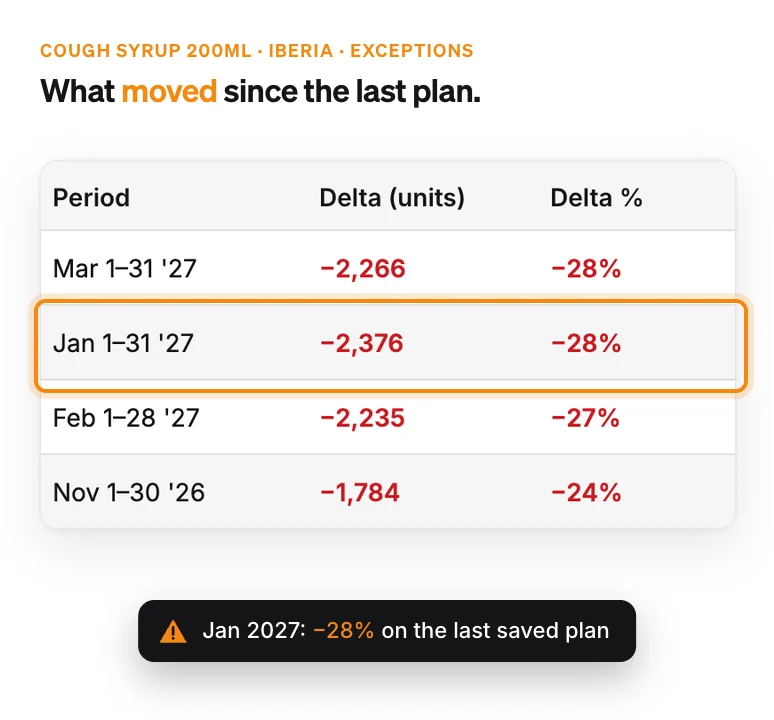
See what moved before the review
PLAIO compares the live plan with the last saved one. Anything past your threshold (20% unless you change it) is flagged, so the review starts on those rows.
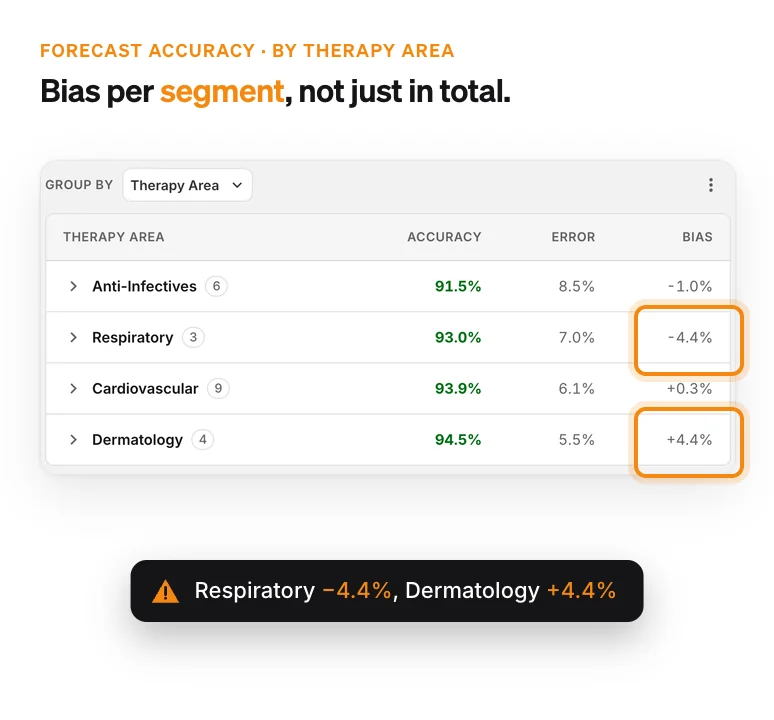
Accuracy per segment
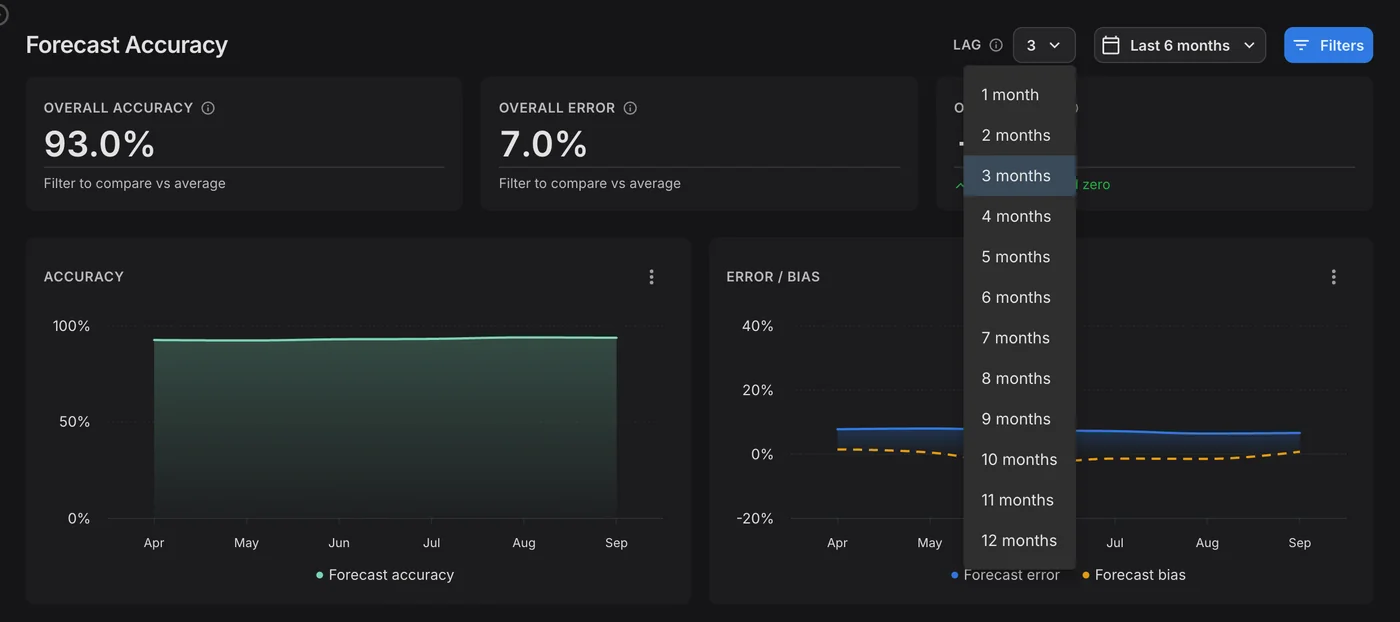
Accuracy, error and bias are reported by the dimensions your plan uses, such as channel or therapy area. A good portfolio number can’t hide a weak segment.
How pharmaceutical forecasting works in PLAIO
A forecast trained on your own sales
The machine learning forecast learns from your monthly sales, item by item and location by location. It picks up seasonality and trend and starts from an item’s first month of sales. A moving average runs beside it, so you can compare the two.
Pick the base, then adjust it
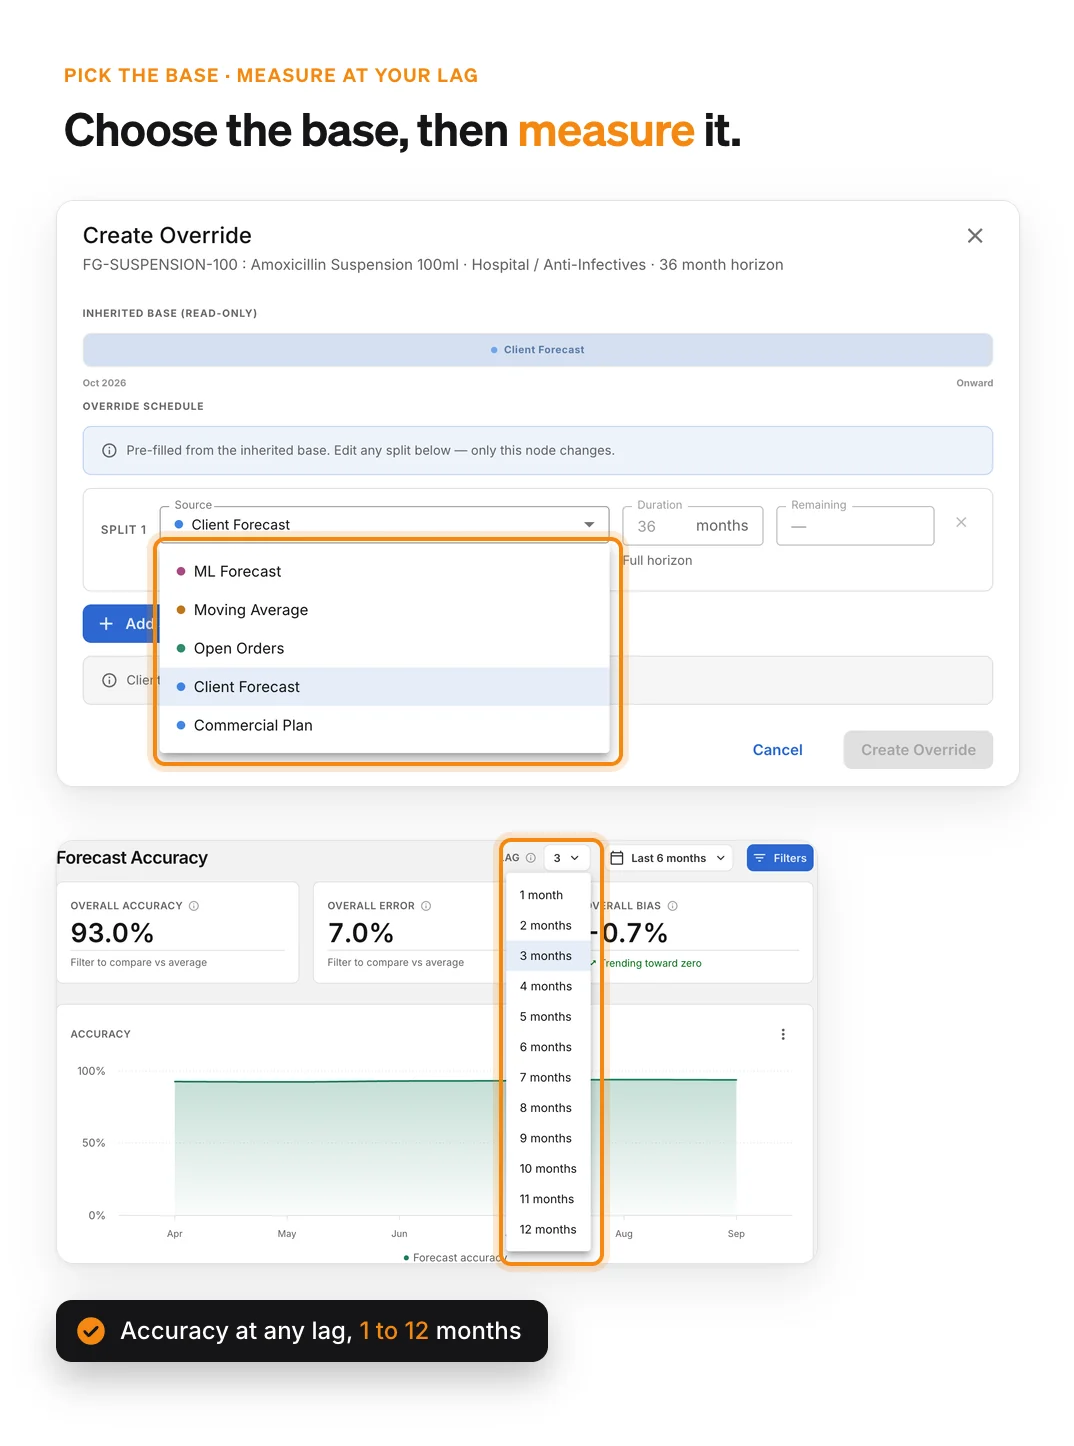
For each part of the horizon you choose the base: the ML forecast, a moving average, open orders or the commercial plan your team uploads. Scale it up or down and add overlays. Set it once for the whole plan, or per item and location.
Save versions and measure at your lag
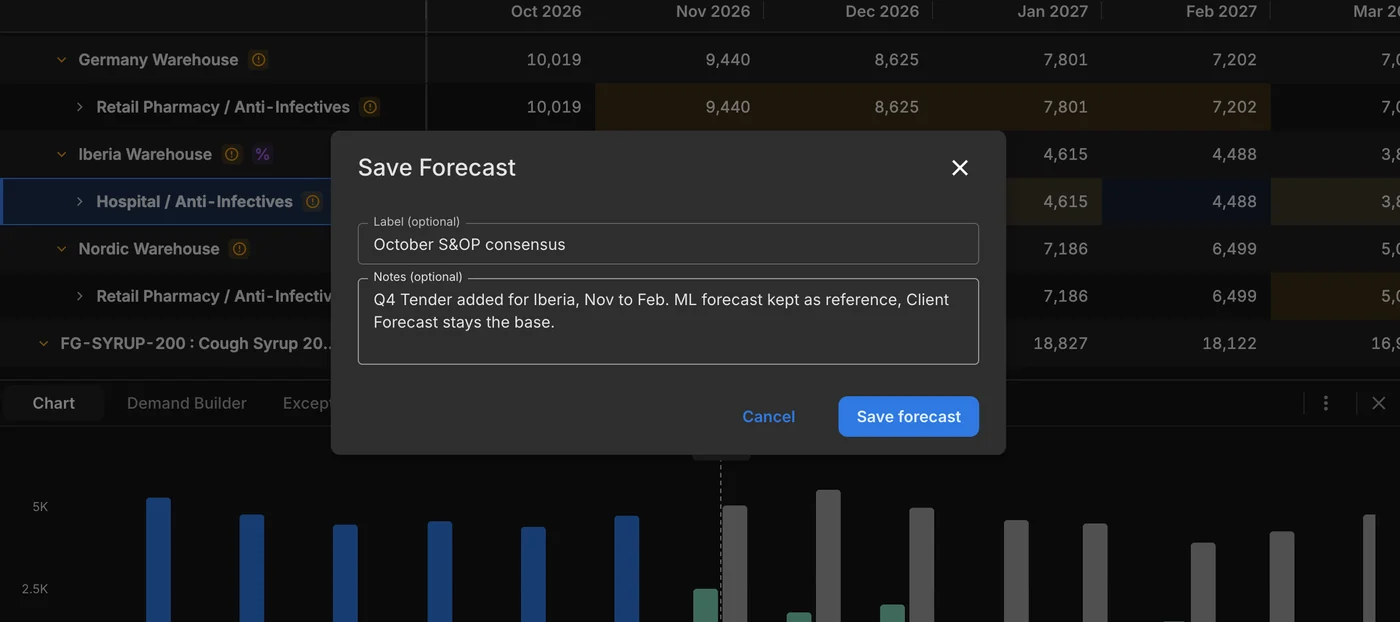
Save a forecast with a label and a note before S&OP. PLAIO also snapshots the plan every month, and scores accuracy, error and bias against actual sales at any lag from 1 to 12 months.
Supply plans on the same number
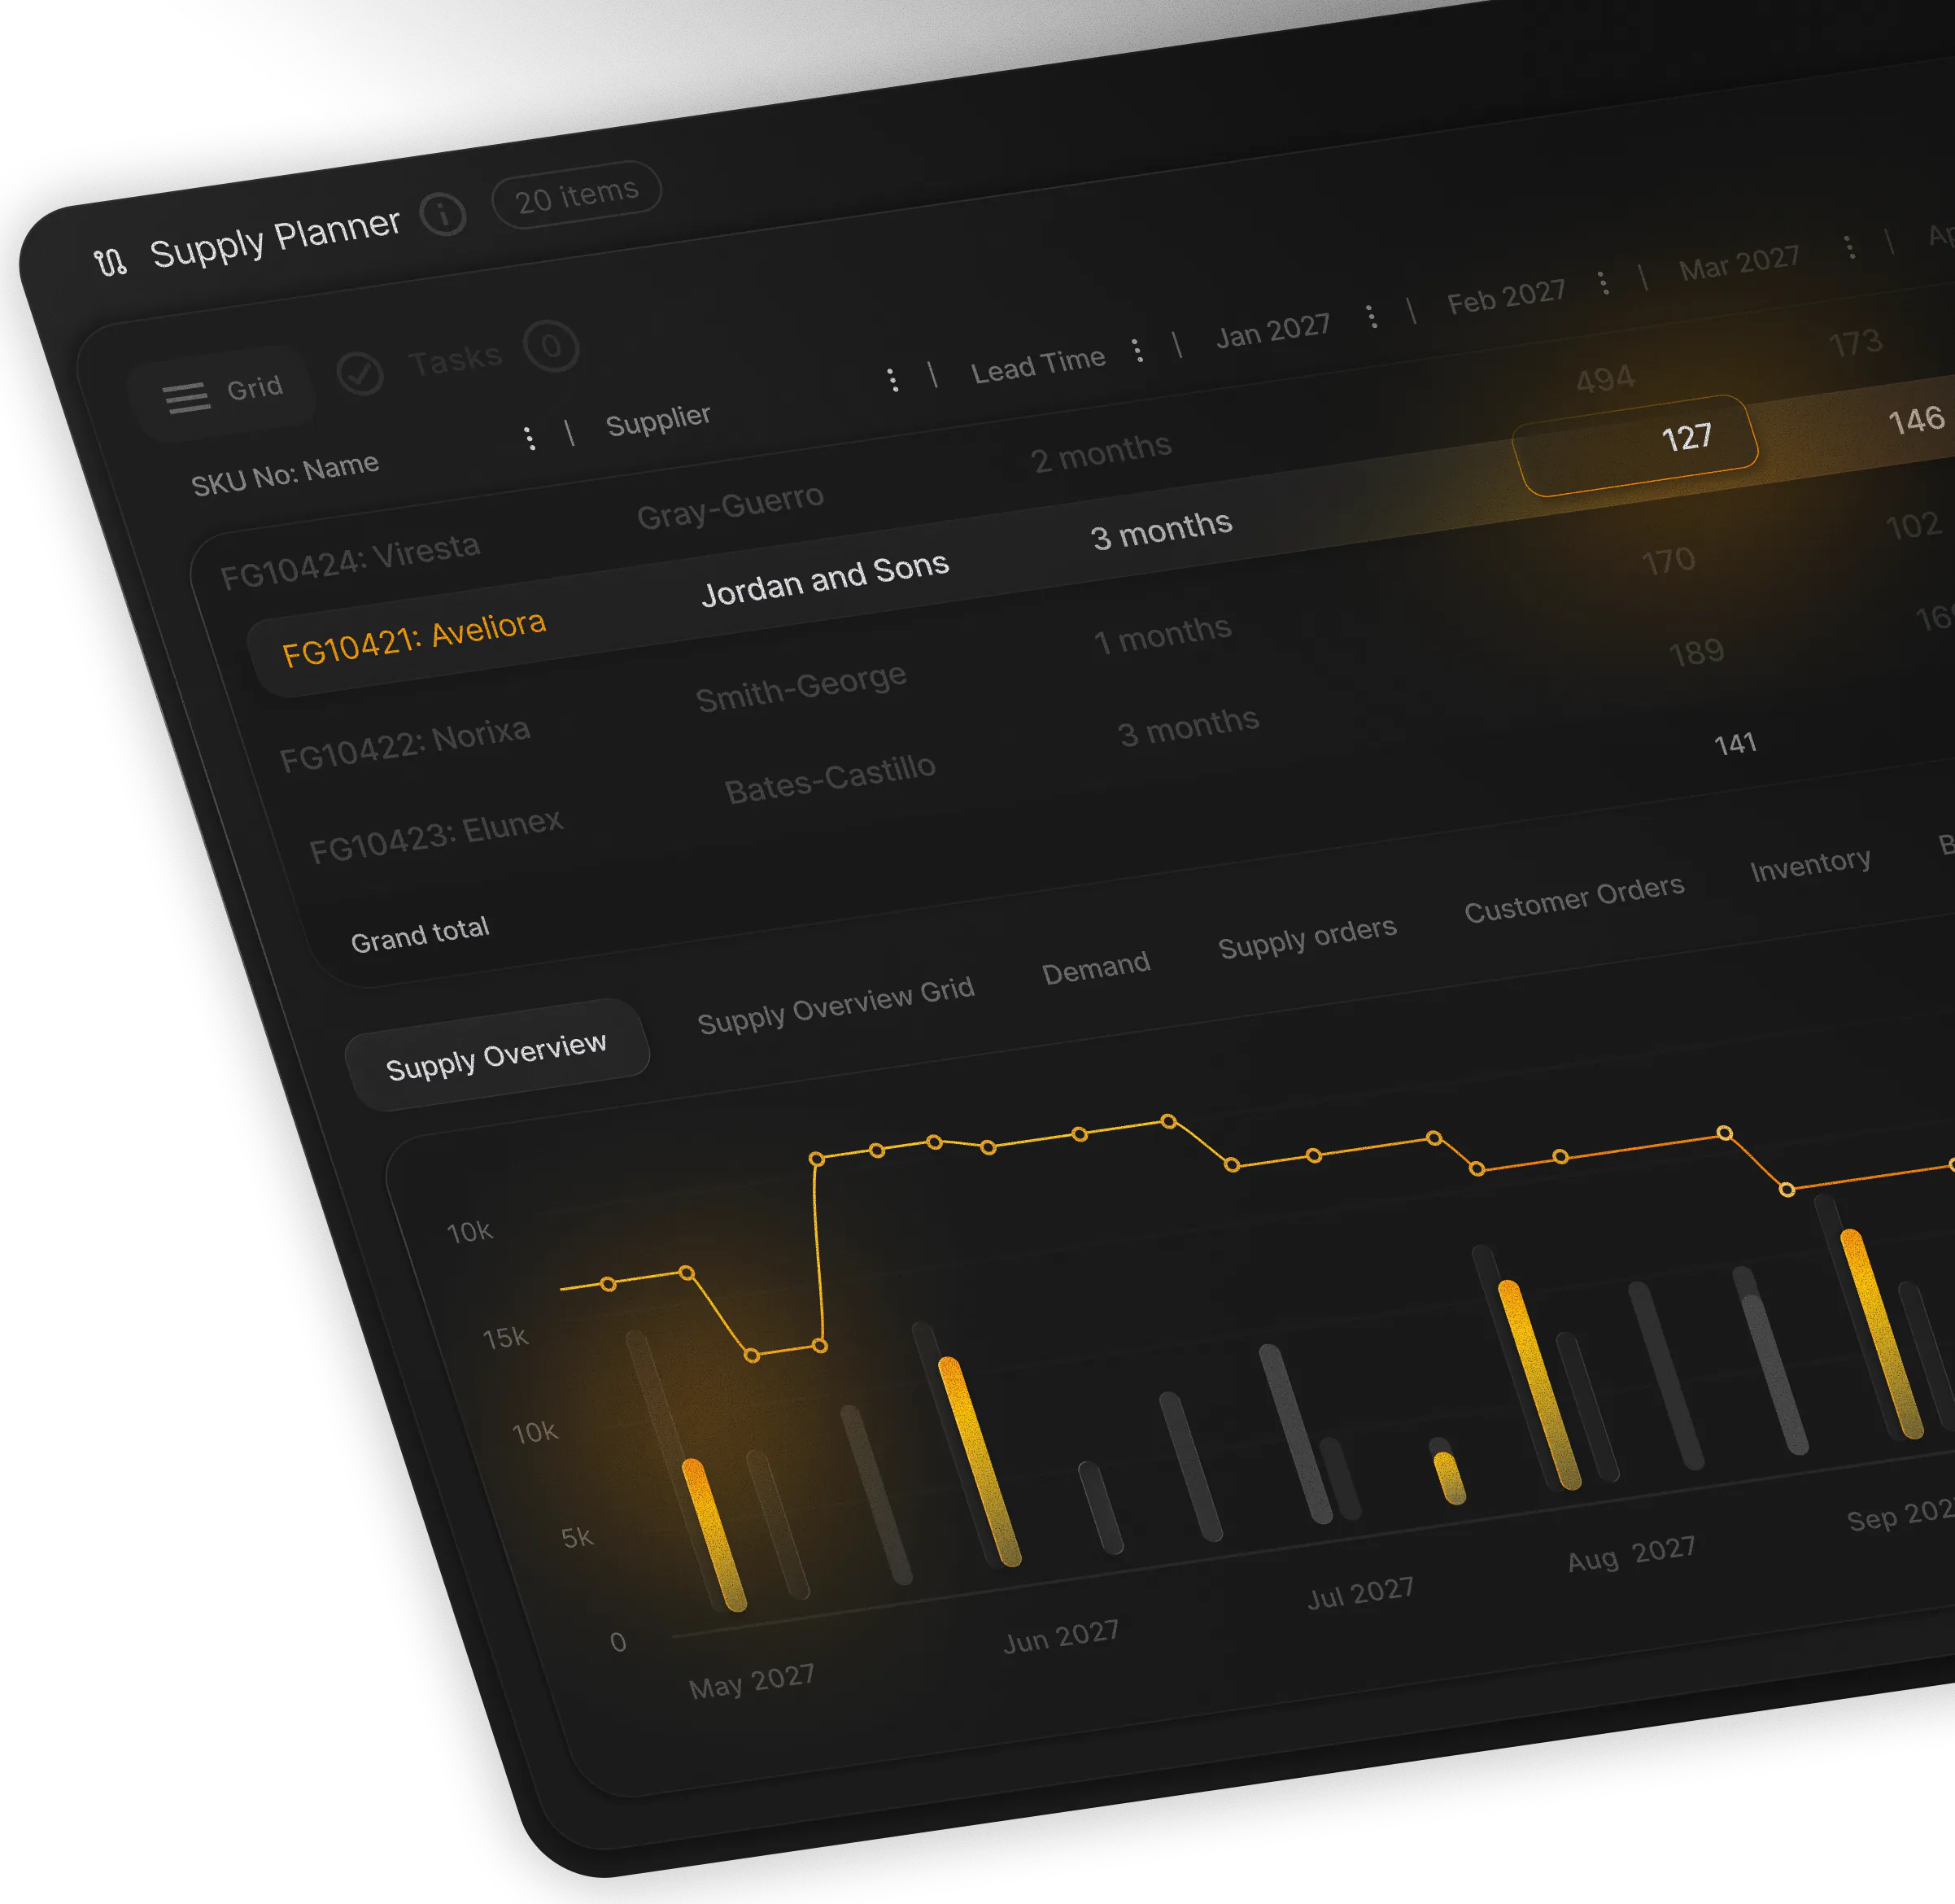
Supply planning reads the forecast directly. When a launch slips you edit one line, and the supply plan picks it up without anyone re-cutting a spreadsheet.
Bring a few SKUs. See them forecast in PLAIO
30 minutes on your own products: the base forecast, the tenders on top, and the accuracy you would report.
Book my 30-minute demo Prefer to read first? 3-step framework for stable pharma forecasting