
Supply Planning
Supply Planner Overview
Goals, main features, and architecture of the PLAIO Supply Planner module.
Overview
Supply Planner is a core module that enables intelligent planning and forecasting of future supply needs. It balances demand and customer orders against safety stock levels while respecting internal and CMO constraints.
Our system uniquely combines top-down and bottom-up planning approaches. Top-down planning generates suggested orders based on unconstrained demand in an ideal scenario, while bottom-up planning accounts for actual availability of intermediates and materials throughout the Bill of Materials (BOM).
Dynamic exceptions alert users to problematic inventory levels and potential future issues, enabling proactive resolution before supply chain disruptions occur.
The module is organised by a list of (item, location) pairs in alphabetical order. The pivoted timeline displays the months in which possible orders can be placed.
Goals
Traditionally, the management of finished goods and materials have been segregated by personas as the process of packing, production and procurement can be different. This version of the Supply Planner attempts to unify the workflow so that dependencies and issues can be viewed in one place (from Finished Goods to Materials) allowing discrepancies to be addressed simultaneously through the chain.
- Visualise the current and future state of inventory based on ordering decisions through time.
- Save time by automatically calculating supply needs based on predefined constraints.
- Allow users to proactively handle exceptions by flagging them in the application.
- Break data silos and maintenance overhead by unifying company supply planning data into one up-to-date platform.
Main Features
Order Suggestions
The module generates order suggestions automatically to address demand-supply gaps. Orders in the system are classified as either Fulfillable (FF) or Unfulfillable (UF) based on the availability of subcomponents.
In the main grid, the user sees the total ideal order quantities they must make to meet their demand and keep their inventory above Safety Stock (FF+UF). In the Supply Overview Grid, they are able to view the breakdown.
Planners can trigger suggestions for all visible lines through a top-level action or target specific (item, location) pairs via right-click context menus.
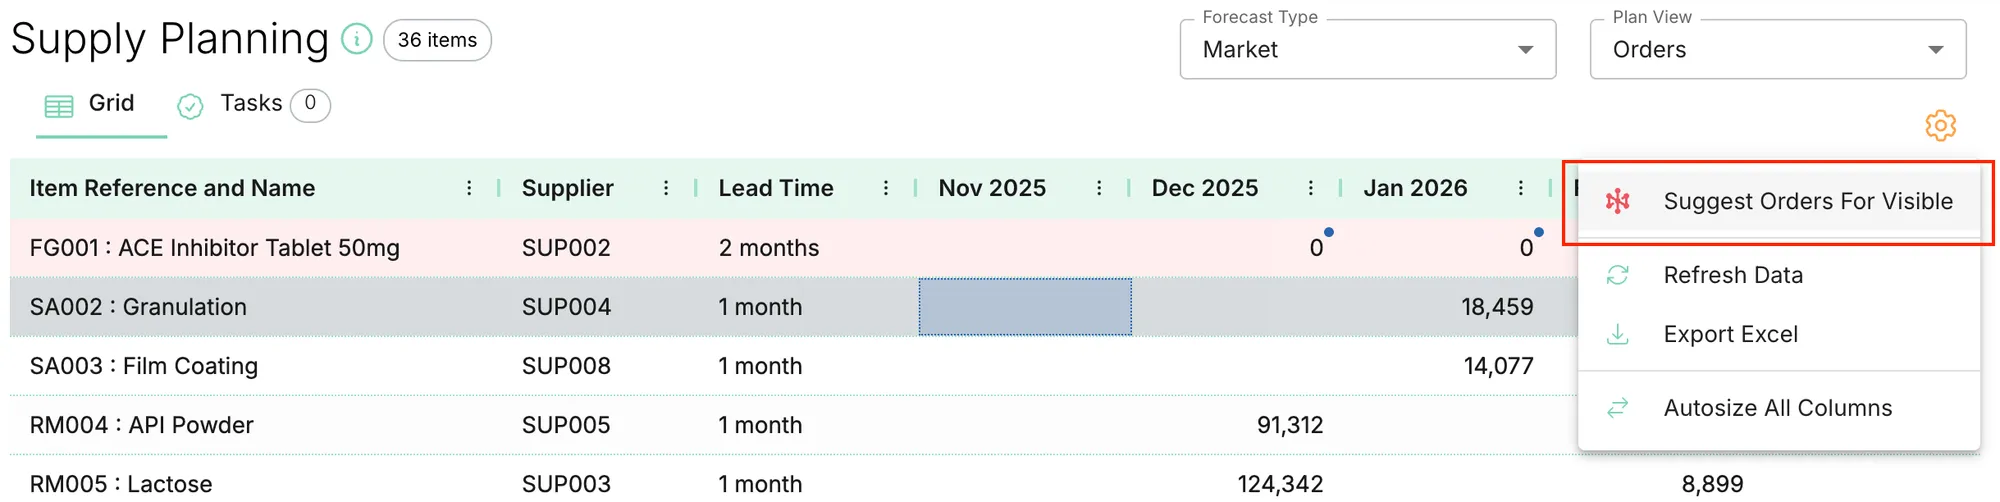
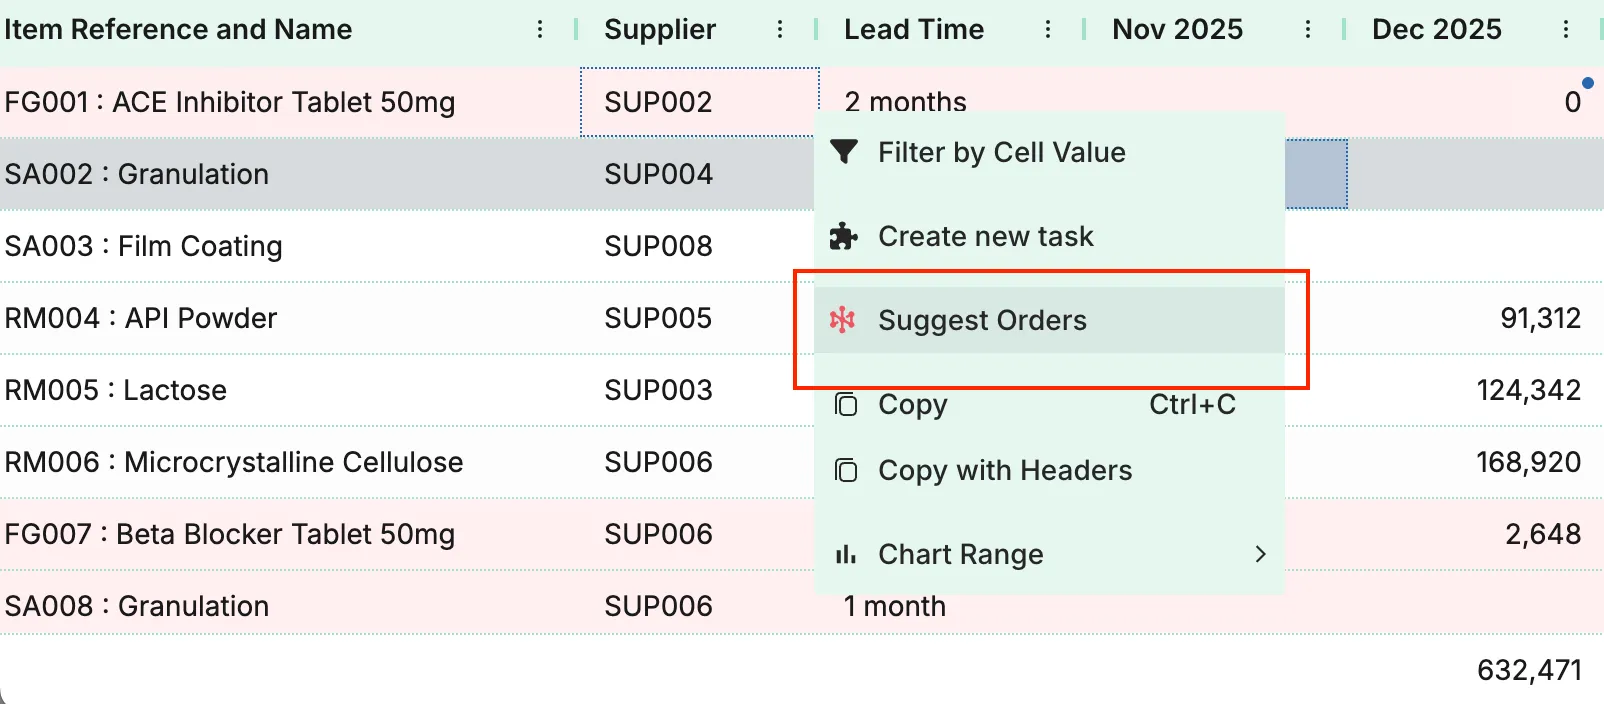
Orders are calculated taking into account:
- Direct and Derived Demand
- Review Period (currently, only 1 month is supported)
- Safety Stock Policy
- Ordering Policy
- Supplier lead times
- MOQ (Minimum Order Quantity)
- IOQ (Incremental Order Quantity)
- BOM structure and quantity requirements
Demand
The Supply Planner propagates Direct and Derived Demand through the layers of the BOM. Which Demand Type to use for the calculation depends on what is selected in the Forecast Type dropdown.
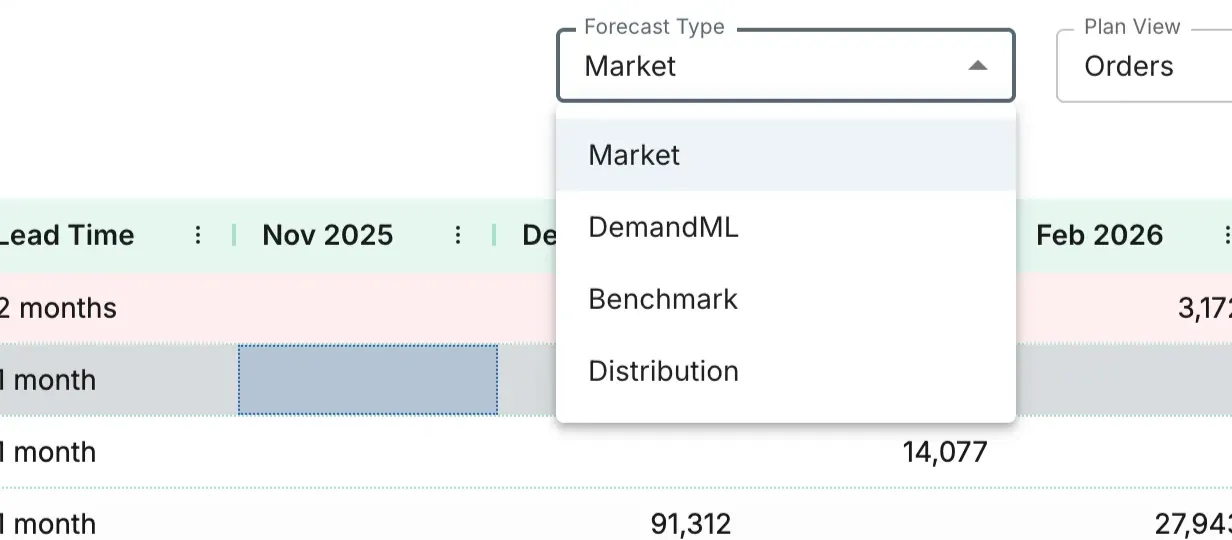
- Direct Demand refers to items that are sold directly, typically Finished Goods and sometimes Semi-Finished Goods. This Demand is passed down directly from Demand Forecast input in the Supply Planner.
- Derived Demand is demand passed down to components as orders are placed to replenish the inventory of the parent item. This value is the entire value needed to fulfil the order of the parent item.
Instant Feasibility Check
The system maintains continuously updated calculations of feasible orders and inventory levels based on the current state of all orders in the planning grid.
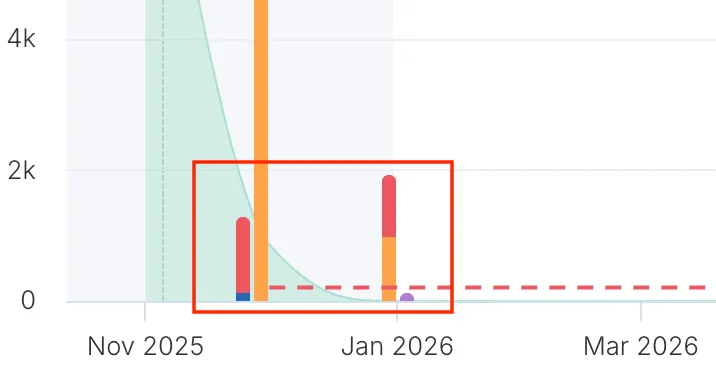
If the user manually overrides the plan, the inventory reflects the changes and displays visual feedback on the corresponding item’s chart. Should any of the new orders be unfeasible (not possible to fulfil due to a component shortage) the bar appears red. On the Overview grid, a user can see which part is fulfillable (FF) and which not (UF).
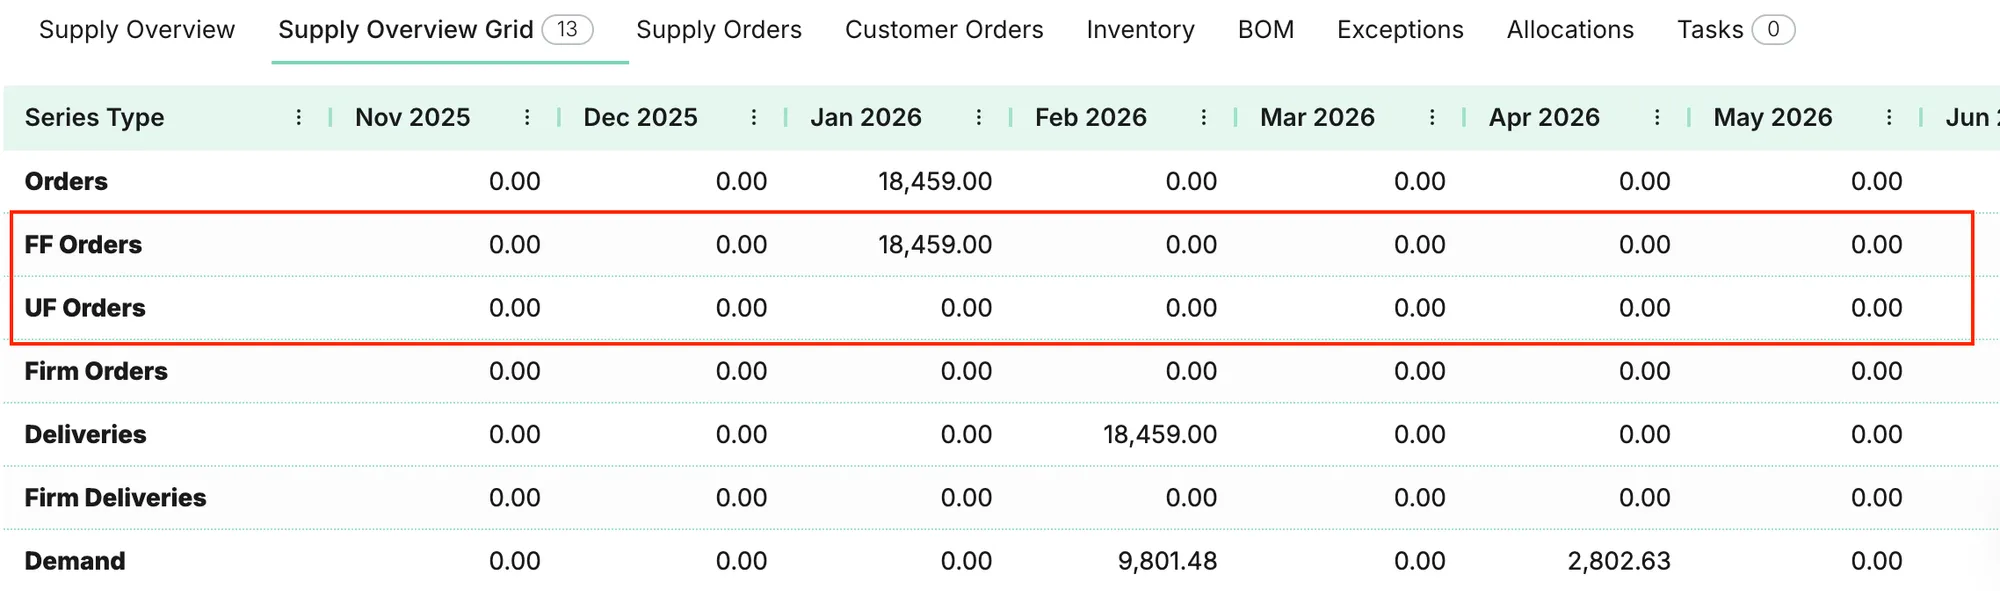
The user can then generate order suggestions on the lower levels to try to fulfil the new derived demand and fix the exception, or accept this issue and try to solve it outside of PLAIO’s system (example: request a rush order from a CMO and increase the inventory by changing Firm Order delivery dates).
Chart and Overview Grid
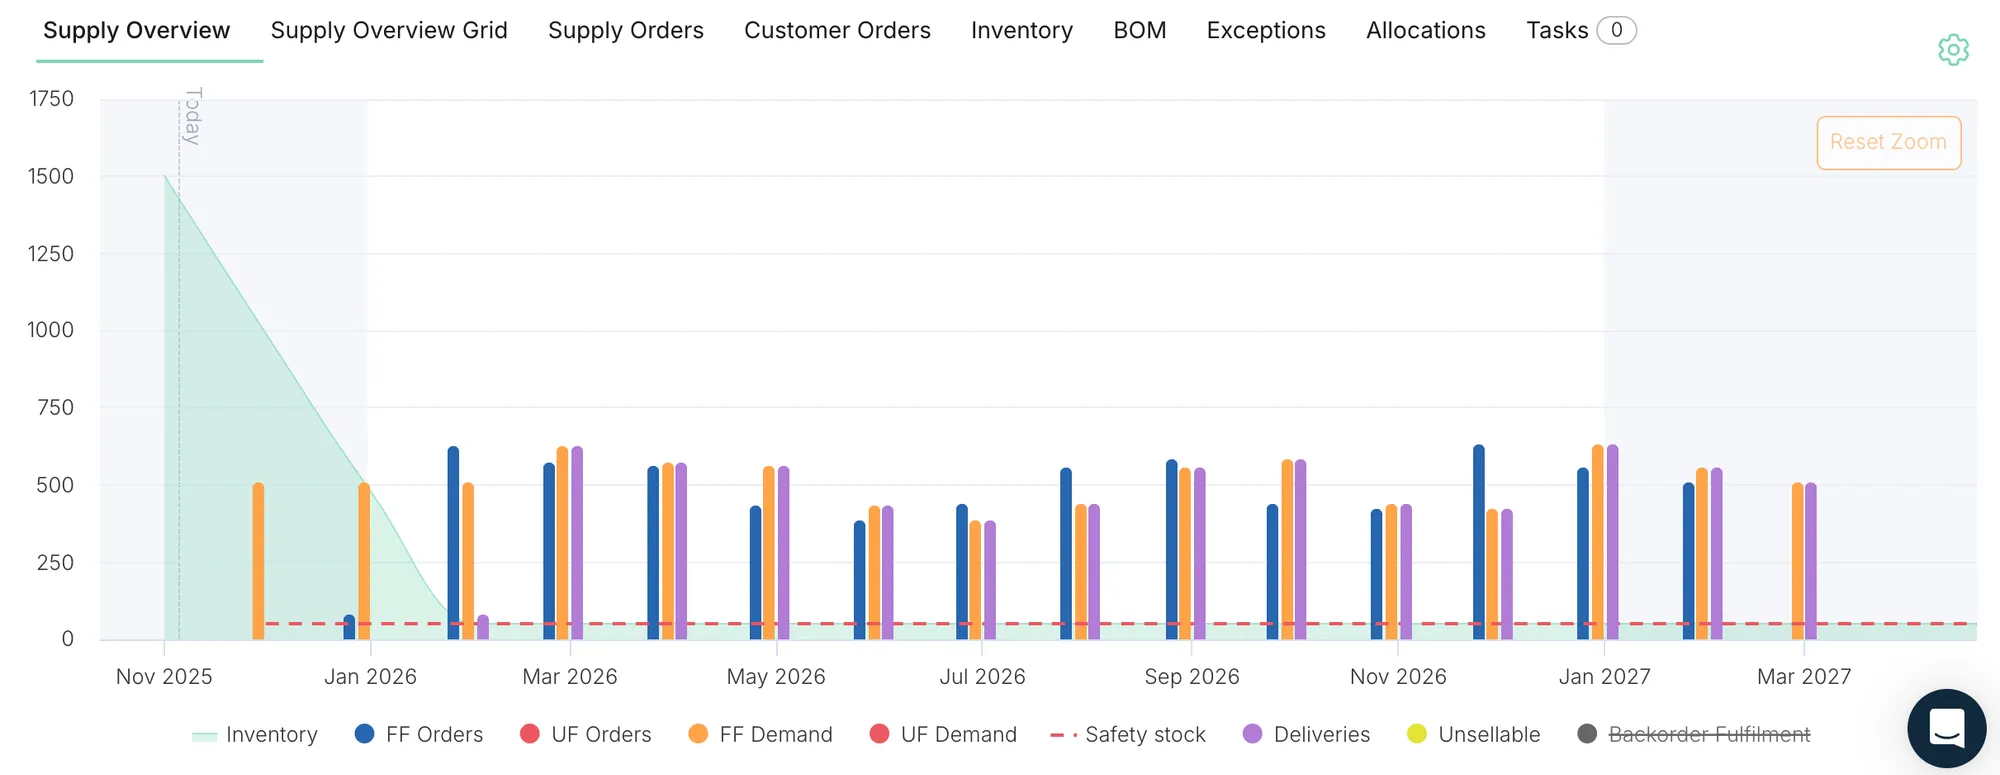
The Chart visualises an item’s Supply Plan over time. It has three main elements:
- Inventory, represented by a green area chart.
- Events such as Orders and Deliveries, represented by the various bars.
- Safety Stock level, represented by a red dashed line.
Unfulfillable (UF) Demand or Orders are shown as red bars stacked on top of Fulfillable (FF) Demand or Orders.
The Overview Grid is the grid representation of the Chart.
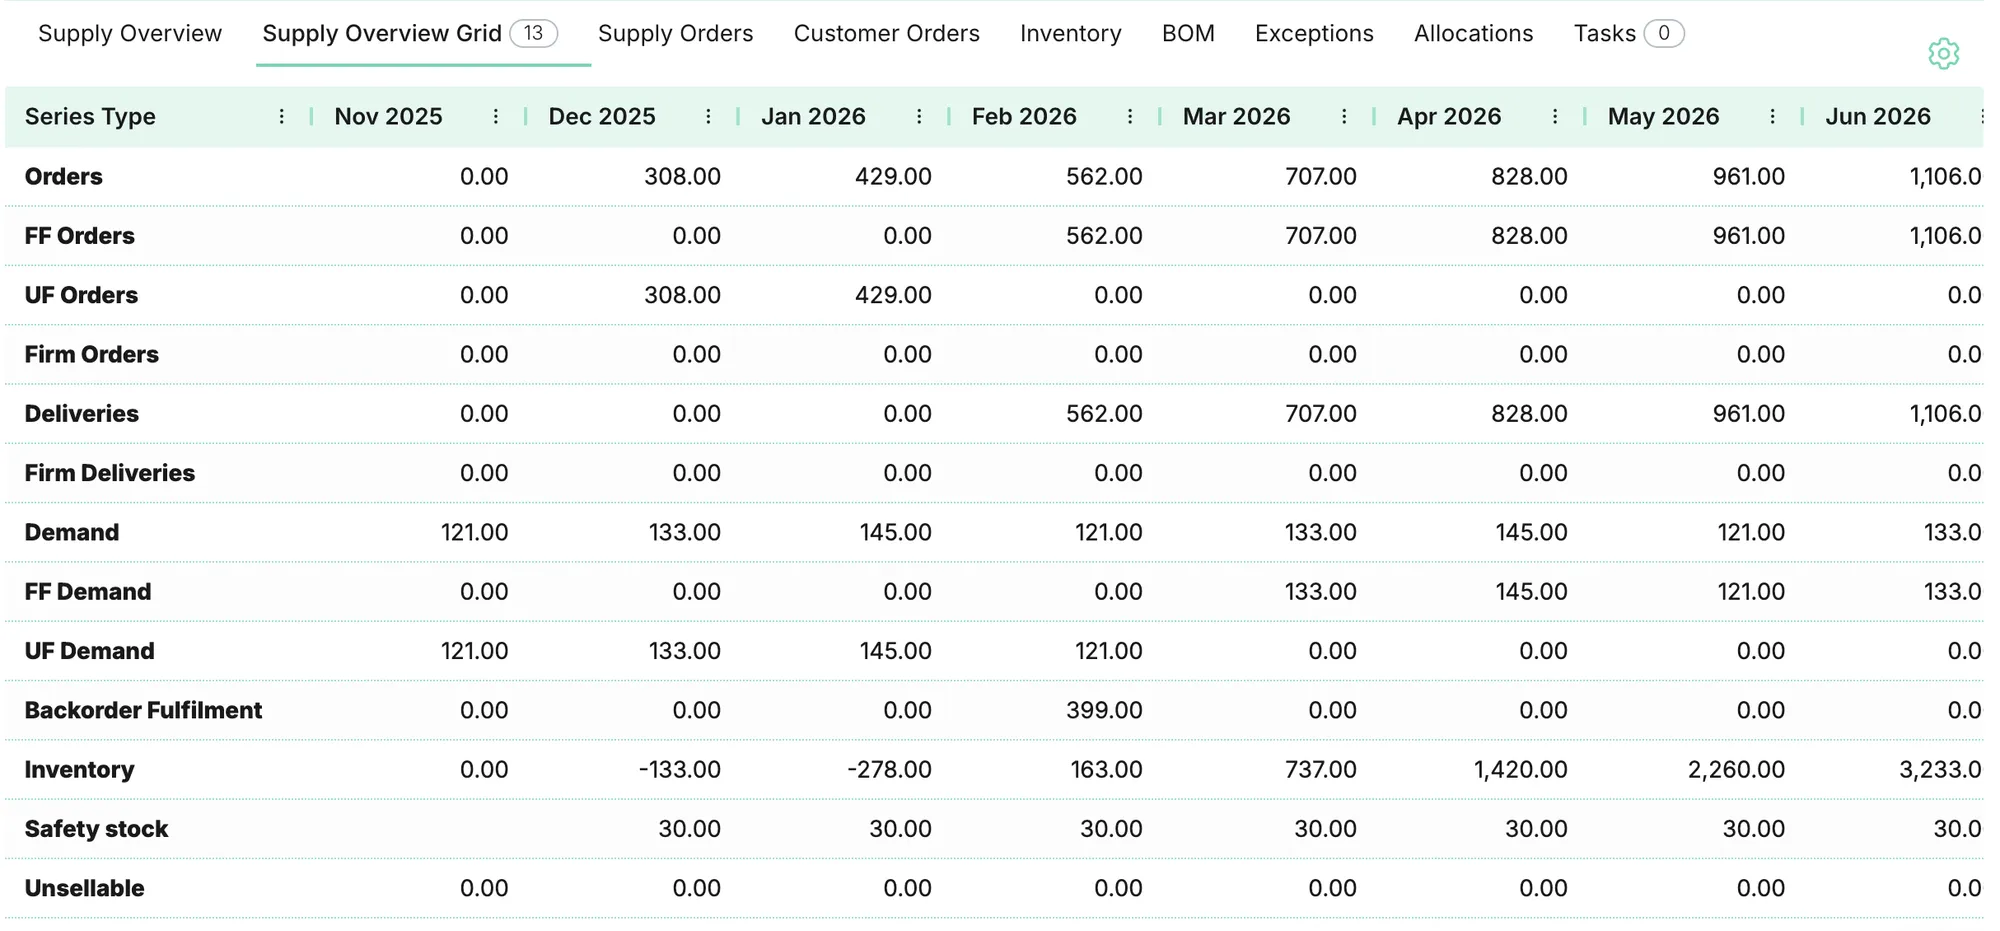
| Series | What it shows |
|---|---|
| Total Orders | The aggregate quantity of Order Suggestions and Firm Orders. |
| FF Total Orders | The aggregate quantity of FF Order Suggestions and FF Firm Orders. |
| UF Total Orders | The aggregate quantity of UF Order Suggestions and UF Firm Orders. |
| Order Suggestions | Generated by PLAIO to meet demand and maintain safety stock levels. |
| FF Order Suggestions | Fulfillable Order Suggestions based on availability of components. |
| UF Order Suggestions | Unfulfillable Order Suggestions based on availability of components. |
| Firm Orders | Orders uploaded by the customer, typically used to account for deliveries and therefore inventory that have yet to arrive. |
| FF Firm Orders | Fulfillable portion of Firm Orders. |
| UF Firm Orders | Unfulfillable portion of Firm Orders. |
| Deliveries | Aggregate quantity in deliveries from Suggested Orders and Firm Orders. Calculated by the standard lead time set in the Supplier Constraints. |
| Firm Deliveries | Deliveries from the Firm Orders (the portion of Deliveries that are Firm). |
| Total Demand | Sum of the Direct and Derived Demand for the item. |
| FF Total Demand | Fulfillable Total Demand. |
| UF Total Demand | Unfulfillable Total Demand. |
| Direct Demand | Demand for items that are sold directly. |
| Derived Demand | Component demand created when items that use this component are planned for production. |
| Backorder Fulfillment | Backorders that were created in the past that can now be fulfilled. See Backorders. |
| Inventory | The quantity available in inventory after completing all transactions of the period. |
| Months of Inventory | Projected inventory coverage based on the rolling average demand of the next X months. |
| Safety Stock | The calculated safety stock quantity for the given date. |
| Unsellable | Quantity of items that become unsellable. |
| COGS Total Orders | The aggregate COGS of Order Suggestions and Firm Orders. |
| COGS Order Suggestions | COGS for Order Suggestions. |
| COGS Firm Orders | COGS for Firm Orders. |
| COGS Unsellable | COGS for inventory that becomes unsellable. |
Realistic Inventory
Inventory calculations are constraint-aware, meaning only Fulfillable (FF) orders, those with full component availability, contribute to projected inventory levels. This ensures planners work with realistic inventory projections rather than optimistic scenarios that ignore component constraints.
In practical terms: if a user optimises their supply by running the order suggestions, their inventory will not update to its ideal state if they do not have the materials required to do so. This avoids users mistakenly approving a plan that ultimately cannot be fulfilled.
Inventory Simulation
The inventory simulation is a complementary functionality that works alongside our Order Suggestions, automatically calculating and determining the inventory levels across time, given incoming orders and various other constraints.
Two special conditions can impact the inventory at differing times across the horizon besides the expected deliveries and demand consumption:
Sellable Until Dates. Any given batch is allowed to be sold until its sellable date and is therefore marked as available inventory until that time. Expiry Date and Minimum Remaining Shelf-Life are controlled in the Items master data. When a batch is past its sellable until date, it becomes “unsellable” and is removed from the overall inventory.
A “Sellable Until Date Override” is also available when a user wishes to designate certain batches as available for longer or shorter than their default time. This is usually tied to making it available for certain markets that allow for a shorter sellable date in order to reduce wastage.
Backorders. Backorders are created when an item that is sold directly cannot meet Demand. These Backorders are then fulfilled as soon as possible and prioritised over new incoming Demand. See Backorders for the full mechanics.
Exceptions
Exceptions are flagged instantly as a user optimises and edits their plan. They are visible at first in the main grid when there is an Unfulfillable Demand.
In addition, the following are visible in the subgrid for any given item:
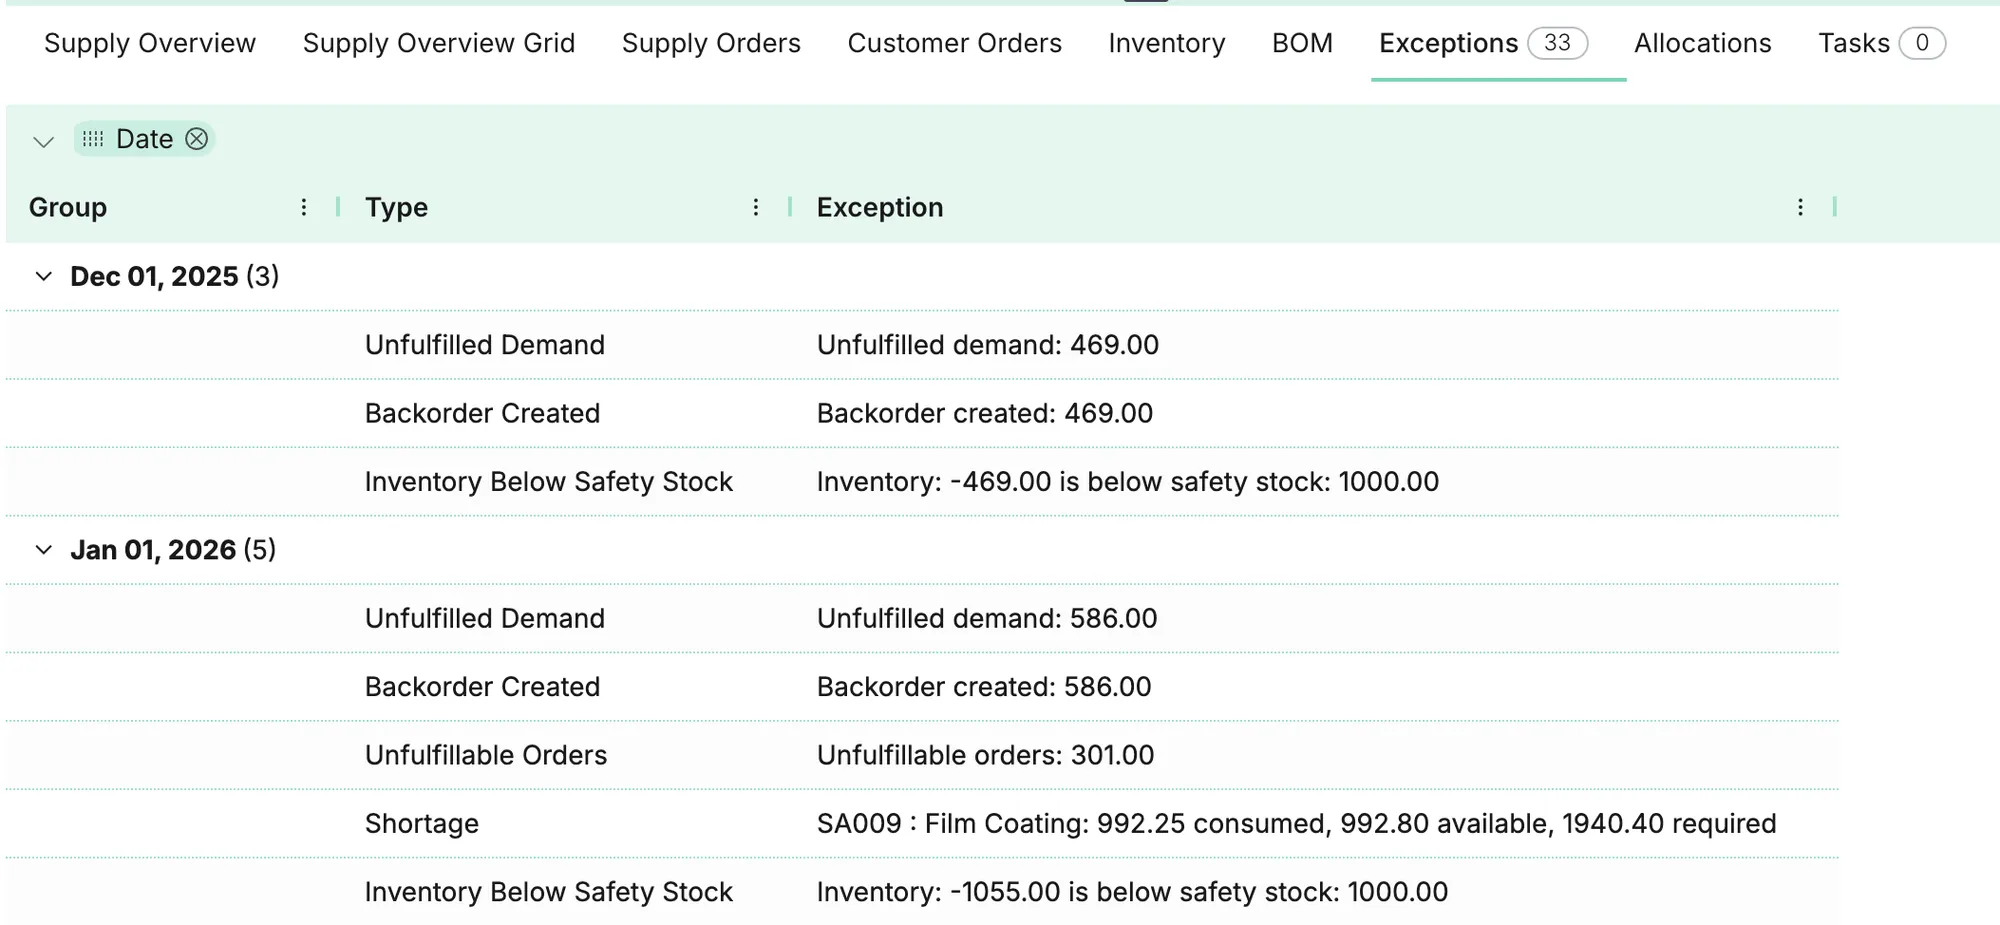
| Type | Description |
|---|---|
| Unfulfillable Demand | Demand that cannot be fulfilled and its quantity. |
| Unfulfillable Orders | Orders that cannot be fulfilled and its quantity. |
| Shortage | When an item cannot fulfil a Derived Demand. |
| Inventory Below Safety Stock | When inventory goes below Safety Stock. The level and what it should be is displayed. |
| Unsellable Inventory | When an item becomes unsellable, its quantity and the equivalent in COGS. |
| Backorder Created | When a backorder is created due to Unfulfillable Demand. |
Allocations
The Allocations tab provides visibility into how selected items are allocated across the BOM structure. When a planner selects an item, they can see which parent items are consuming it, helping identify which parent assemblies or finished goods are affected by bottlenecks at the component level.
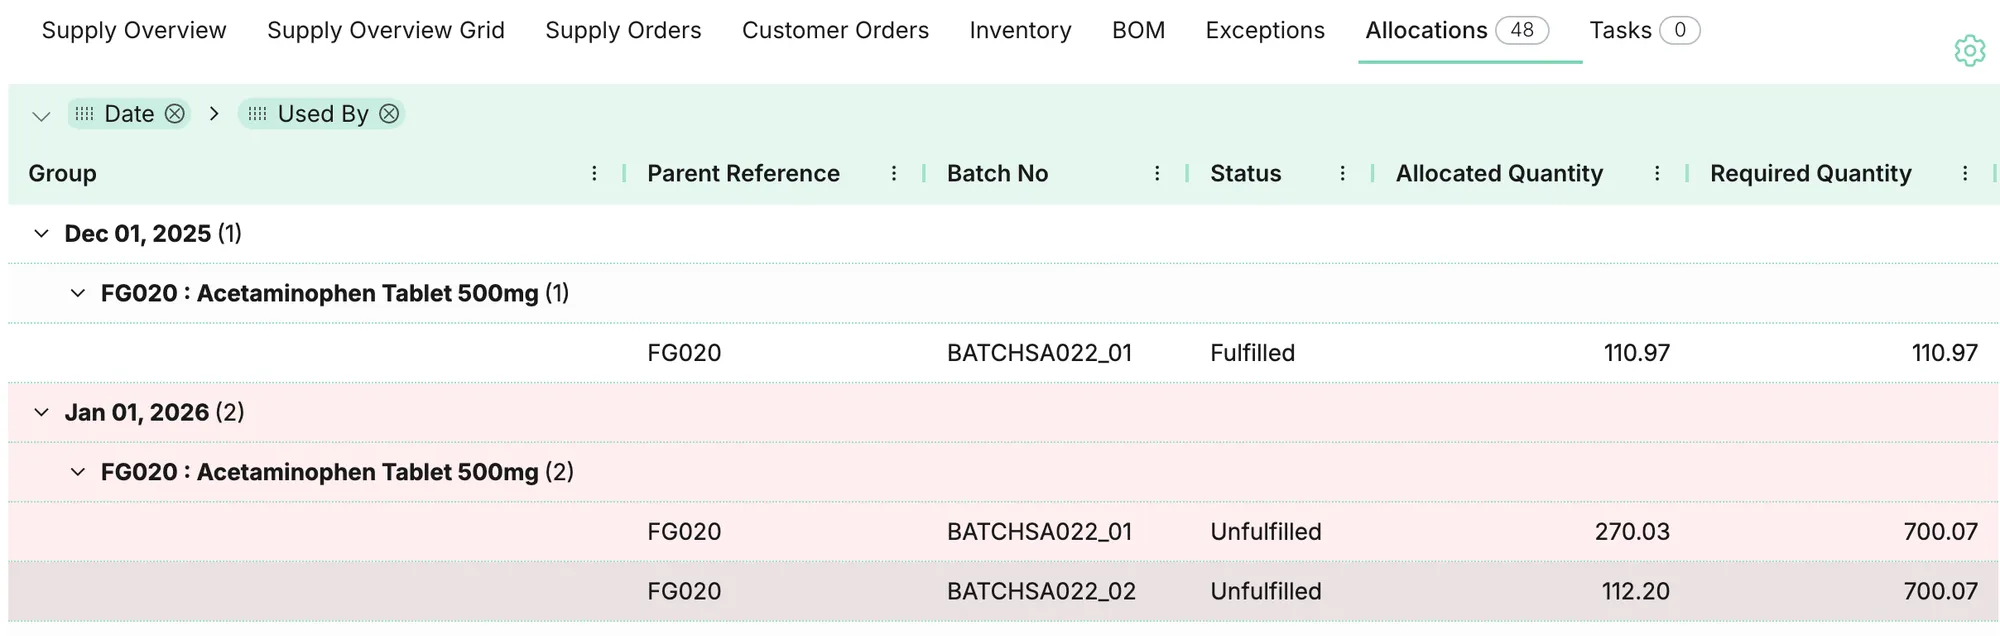
The Status column displays whether the required amount is fulfillable or not based on the available inventory at the time. This can be a mix of real or simulated inventory. If the Status is Unfulfilled, the line turns red to let the user know there is an exception. Simulated inventory is prefixed by “PLAIO” and is inventory created by Suggested Orders.
Batches are allocated by a simple FEFO method. If two or more parent items require the component at the same time, it is prioritised by the item’s PLAIO internal ID, ascending.
Delivery View
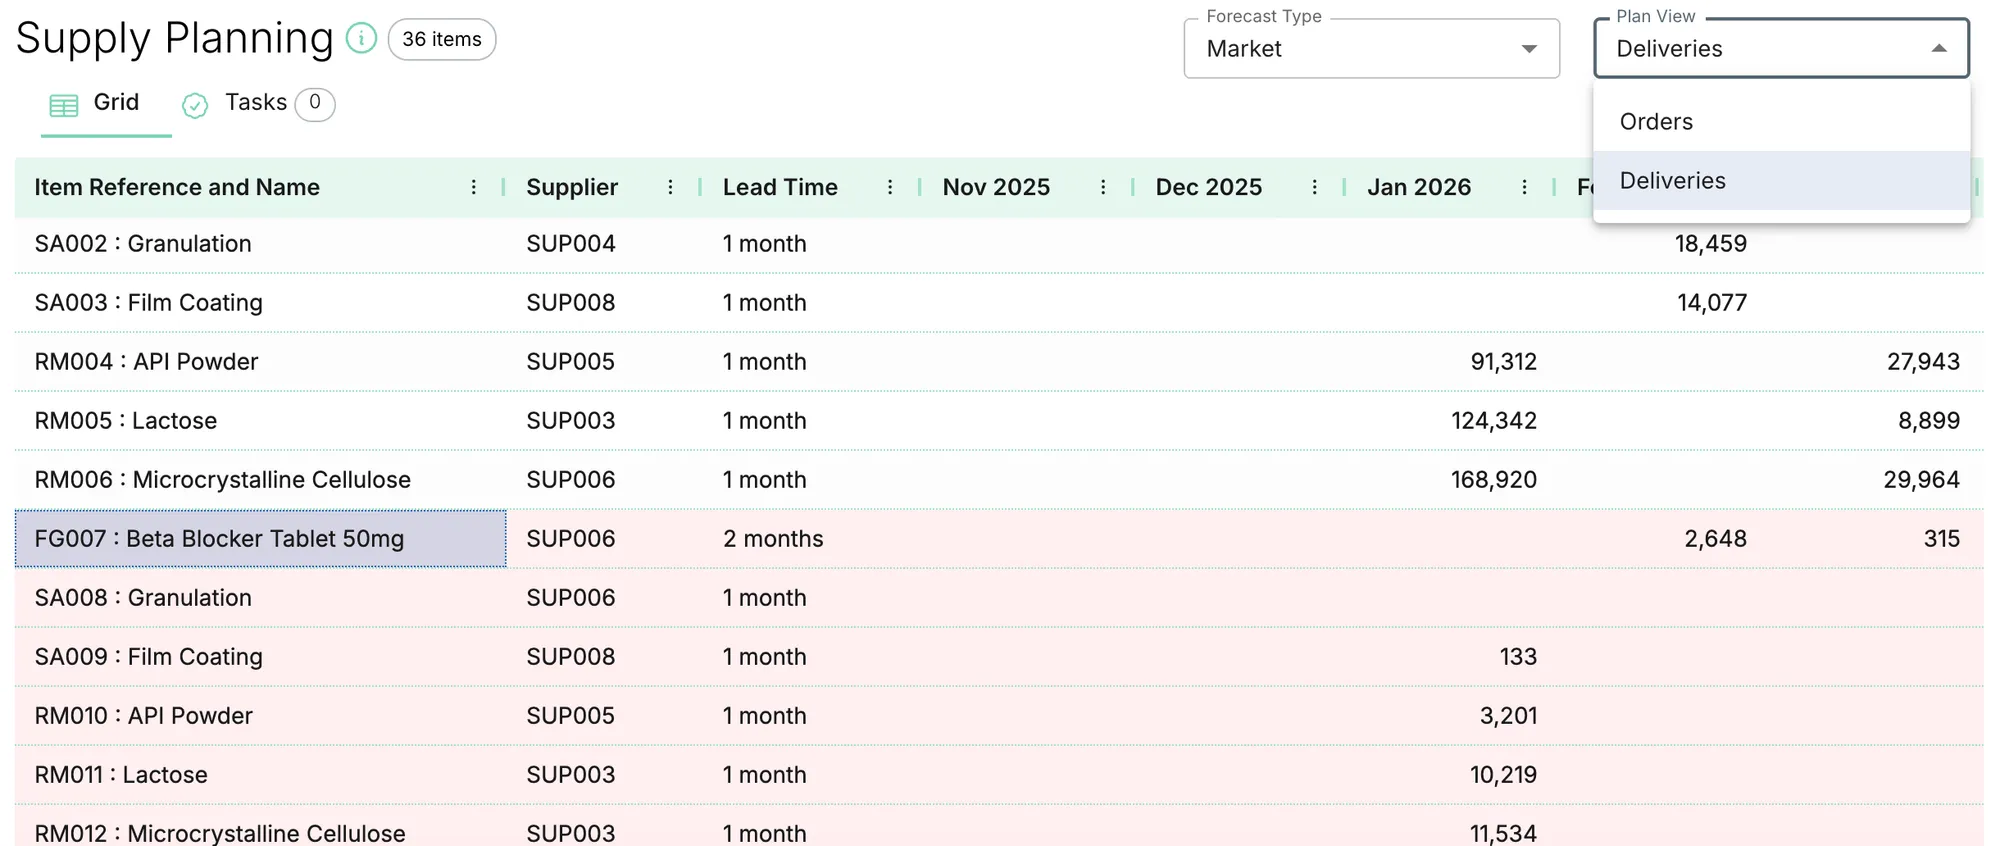
A user may switch their view to Delivery mode to see when the suggested orders will arrive based on standard lead times. This is a read-only view that aims to make it easier for a user to see how their ordering plans arrive and become available inventory. It cannot support manual delivery date changes, with the exception of Firm Orders.
Settings and Constraints
Item settings
| Setting | Description |
|---|---|
| Shelf Life | The shelf life length (d/m/y). Item does not expire if set to 0. |
| Minimum Remaining Shelf Life | Used to calculate Sellable Until Dates. |
| Unit COGS | Used as a fallback value for existing inventory cost calculation or the default for simulated inventory. |
Inventory Policies
Inventory policies are configured per (item, location) pair in the Inventory Policies worksheet.
| Setting | Description |
|---|---|
| Safety Stock Type | Fixed or Dynamic (in d/w/m/y). |
| Safety Stock | Fixed (quantity) or Dynamic (number of d/w/m/y of demand a customer wants to cover). |
| Planning Strategy | MTO (Make-to-Order) or MTS (Make-to-Stock). |
| Order Policy | The Order Policy desired for the item. Managed in the Order Policy worksheet. |
Order Policy
| Setting | Description |
|---|---|
| Policy Type | Standard (order at desired granularity any time an item is needed). Order Coverage (orders to cover a specified period of demand when simulated future inventory drops below safety stock; order quantity is calculated to meet demand over the coverage period and maintain safety stock, while respecting MOQ/IOQ). |
| Coverage Period | Desired coverage period in d/w/m/y. |
Supplier Constraints
Supplier Constraints define how items flow between locations (source → destination).
| Setting | Description |
|---|---|
| Source Location | The location from which the item originates. |
| Destination Location | The location to which the item flows. |
| Order Type | Purchase (from suppliers/CMOs), Production (manufacturing), or Transfer (between your locations). |
| Lead Time | The time it takes for an item to become available for consumption in our customer’s inventory. |
| Minimum Order Quantity | The minimum quantity that needs to be ordered by the Supplier. |
| Review Period | The frequency periods in which the system is allowed to make orders. |
| Incremental Order Quantity | Generally the same as the batch size of a product. The quantity in which larger orders must increment by after its MOQ. |
UX details
Visual indicators for manual edits
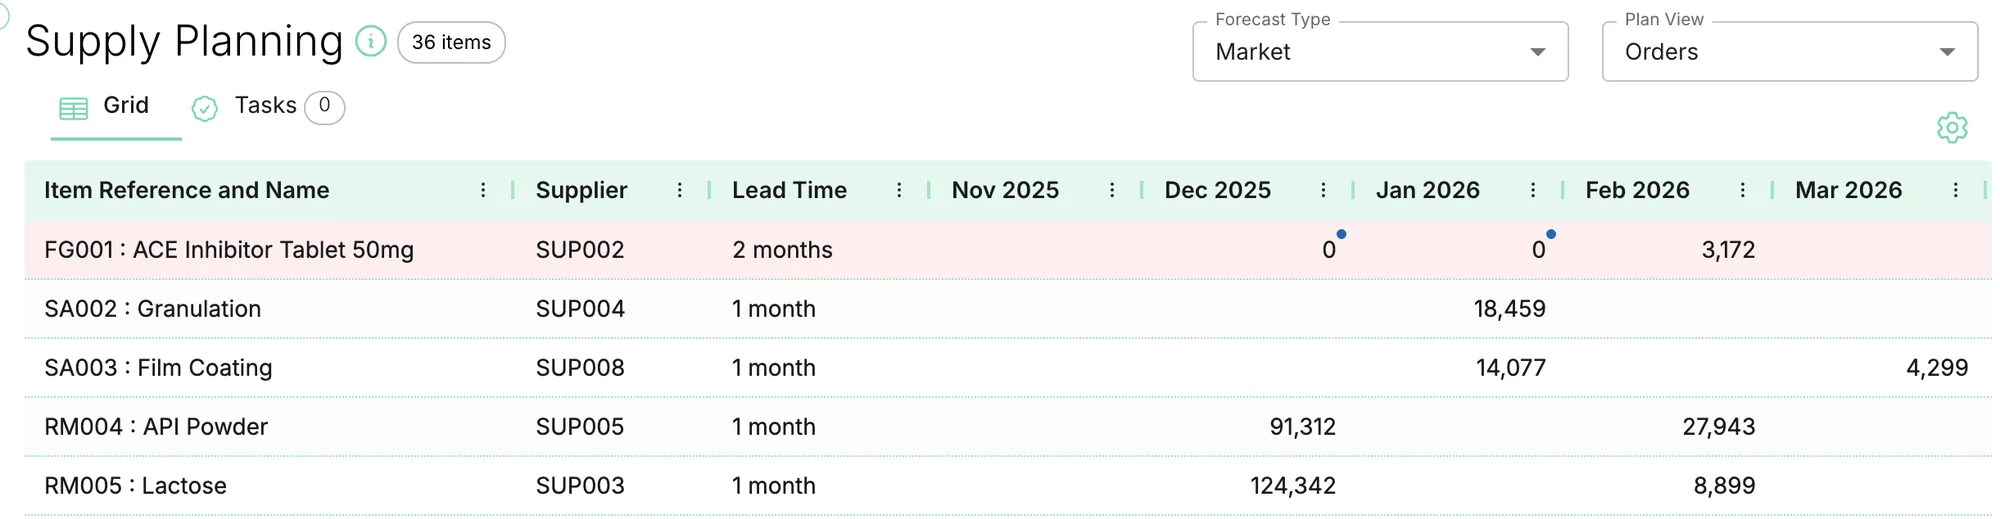
Manual edits are marked with a blue dot to make it easy for the user to identify manually edited values.
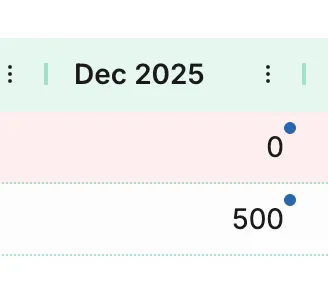
Manual edits are respected by automated Order Suggestions and are not changed. If the user prefers not to order certain months, they should write “0”. To delete manual edits, the user should delete the value, which makes that cell available again for suggestions.
Advanced filters
The module supports sophisticated filtering to help planners focus on relevant subsets of the planning problem. Dependency group filtering allows isolation of independent component families that can be planned separately without cross-dependencies. Additionally, global BOM level filtering enables planners to focus on specific tiers of the product structure, from raw materials through finished goods.
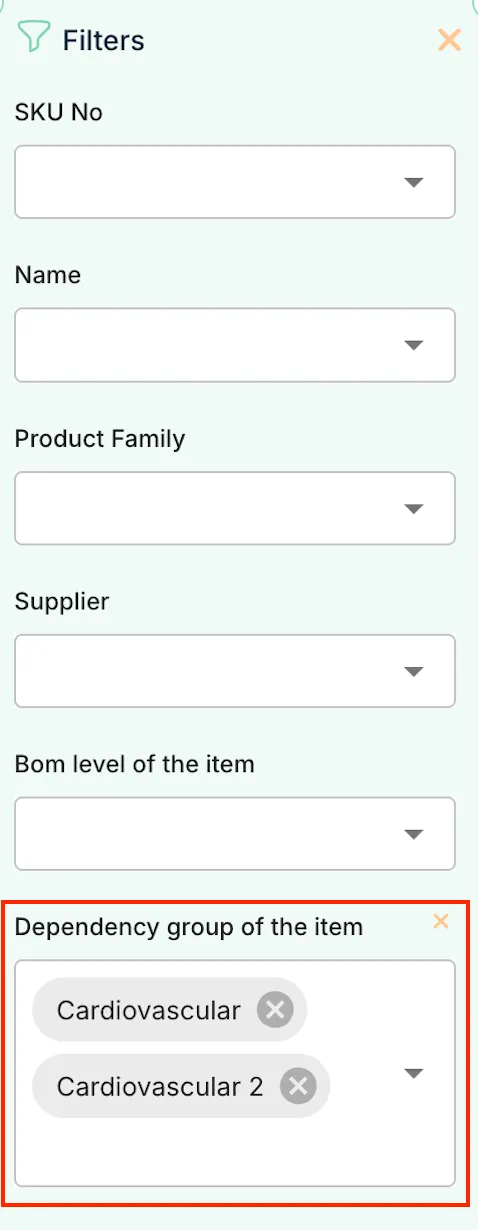
Dependency groups are defined by analysing all weakly connected components to the item via the BOM structure, which yields a maximal set of items where every item in the group is reachable (by traversing up or down the BOM).
Can't find what you need? Email help@plaio.com and we'll get back to you within a few working hours.